Orchestration
morca, a pipeline orchestrator in Mojo
morca runs data pipelines written in Mojo. A pipeline is Mojo code, and the compiler checks how its steps connect. A scheduler starts its runs on a cron schedule, when an upstream table gets a new snapshot, or to fill a range of days. A web UI shows what ran, what is running and what failed, and lets you rerun, backfill or cancel. The data lives in Apache Iceberg tables in object storage.
The Mojourney census runs on it. Its runs are public at orca.mojourney.dev, so everything in this post can be checked there. At the time of writing it has seven pipelines and 5,152 runs.
Writing a pipeline
A step is a top-level def with a typed input and output. Step[...] gives
it a name, its types and its kind. A Mapped step runs once per partition,
and a Gather step runs once per run over all of them. after= names the
step it follows, and Pipeline[...] lists the steps. This is the example
from DESIGN.md,
a load of the NYC taxi files:
from dista import Seq
from orca import Ctx, Step, Mapped, Gather, Pipeline, Month, orca_main

def download(mut ctx: Ctx, month: Month) raises -> RawFile: ...
def load(mut ctx: Ctx, raw: RawFile) raises -> Loaded: ...
def compact(mut ctx: Ctx, loaded: Seq[Loaded]) raises -> Int64: ...

comptime Download = Step["download", Month, RawFile, download, Mapped]
comptime Load = Step["load", RawFile, Loaded, load, Mapped, after=Download]
comptime Compact = Step["compact", Seq[Loaded], Int64, compact, Gather, after=Load]

comptime Taxi = Pipeline["taxi", Download, Load, Compact]

def main() raises:
    orca_main[Taxi]()
An edge is a type check. Load takes what Download returns, so declaring
Load with an Int input fails the build. The repo keeps one pipeline per
rule in tests/compile_fail/. orca_main turns the file into a binary with
its own command line (describe, run, resume, status), and the
scheduler knows the pipeline only through that binary.
A step runs in the run’s driver process. When it has heavy work, it hands it to dista, the distributed task runtime, also in Mojo. A run gets a dista runtime of its own, and a step can fan its work out into dista tasks on the run’s workers. So a step is a unit of orchestration, with its own status, retries and logs, and a task is a unit of compute inside it.
Partitions, schedules and sensors
Partitions are days, months or keys. The census’s mojo_history is keyed by
repository, so a run’s partitions are names such as bgreni/EmberJson. Its
gharchive pipeline is daily from 2023-01-01 and fires at 03:00 UTC for the
day before:
comptime GhArchive = Pipeline[
    "gharchive",
    LoadDay,
    tasks=GhTasks,
    partitions=Daily["2023-01-01"],
    schedule=Cron["0 3 * * *"],
]
A step declares the tables it reads and writes. A pipeline with
sensor=True starts a run when another pipeline commits a snapshot to a
table it reads, for the days that snapshot holds. That is how the census is
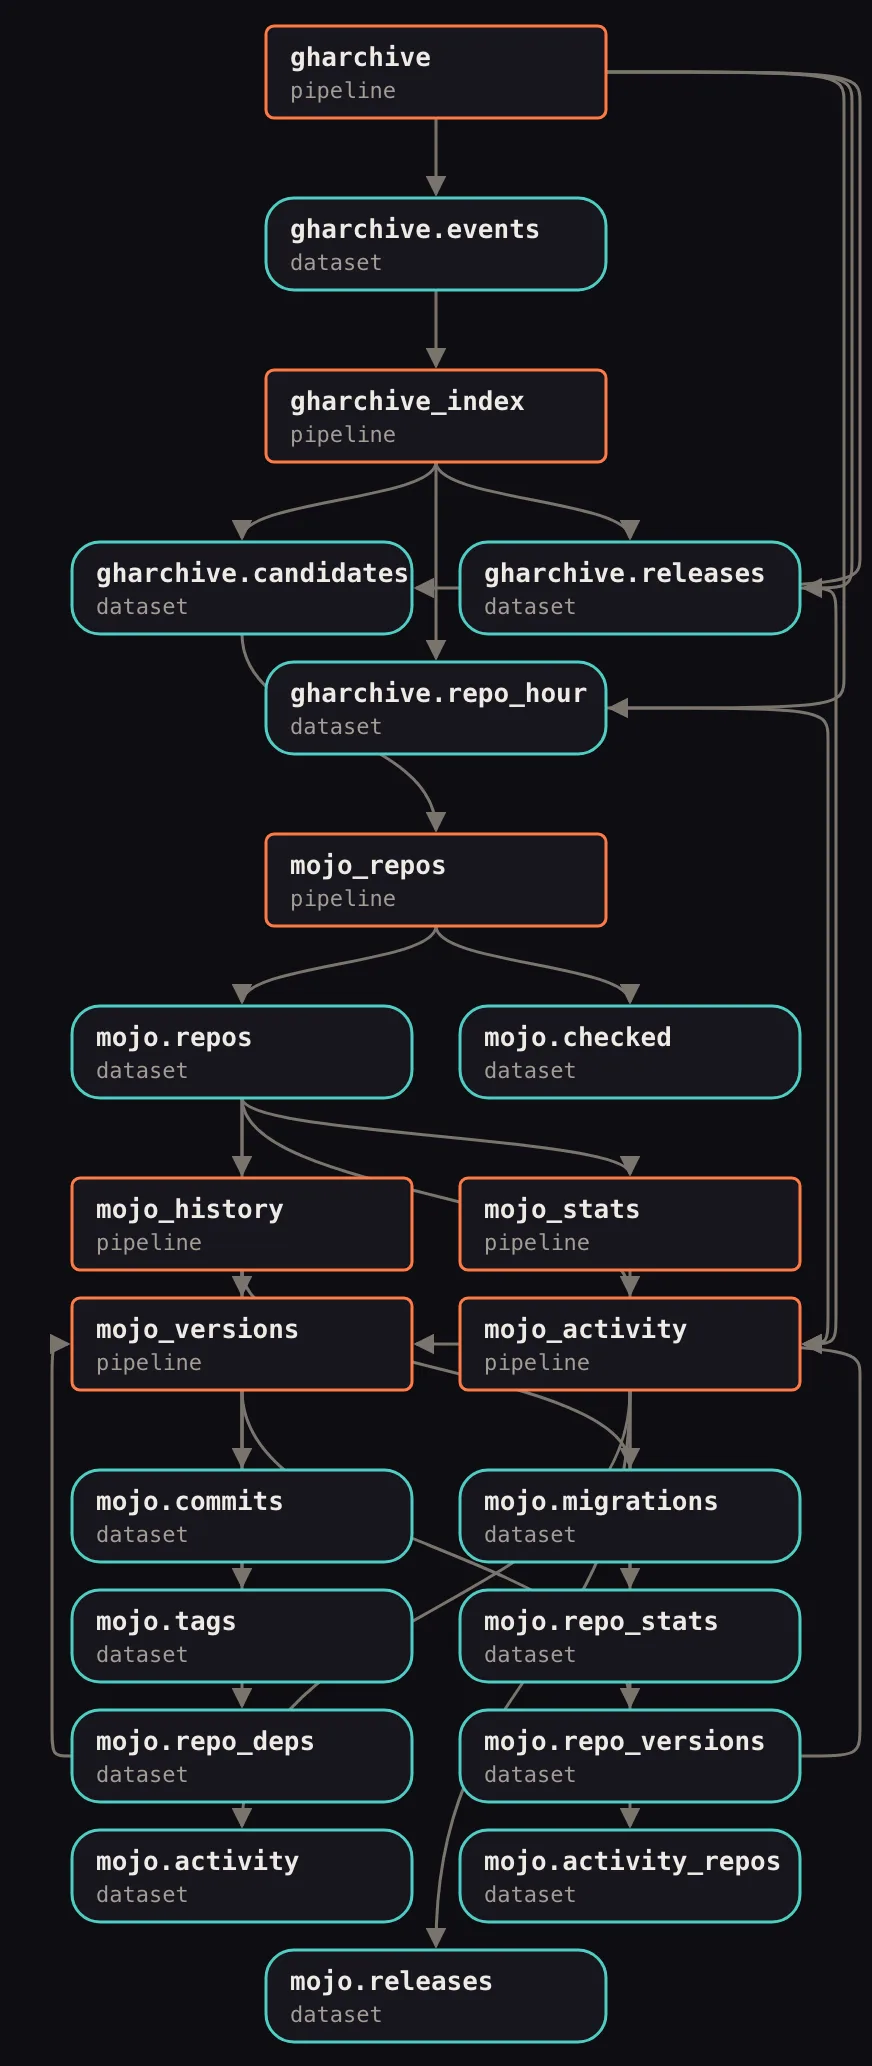
chained: mojo_repos and mojo_activity follow what gharchive commits.
With fills = "all" in orca.toml, the scheduler fills a pipeline’s whole
range by itself, oldest first, one partition per run, within a window and a
budget. orca backfill queues a range by hand. A failed run resumes at the
step that failed, and orca rerun <run> <step> runs it again from a step.
Tables and lineage
Steps read and write Iceberg through iceberg.mojo and parquet.mojo. A step’s first attempt reads a table at its current snapshot, and morca records which. A retry reads the same snapshot, whatever was committed in between.
Every snapshot a step commits carries the pipeline, run, step, partition and
attempt in its summary properties. If an attempt commits and dies before
morca records it, the retry finds that snapshot with find_commit and does
not write the data again. The same properties give lineage: each snapshot’s
page in the UI lists its Upstream and Downstream, and orca rebuild reruns
everything downstream of a table.
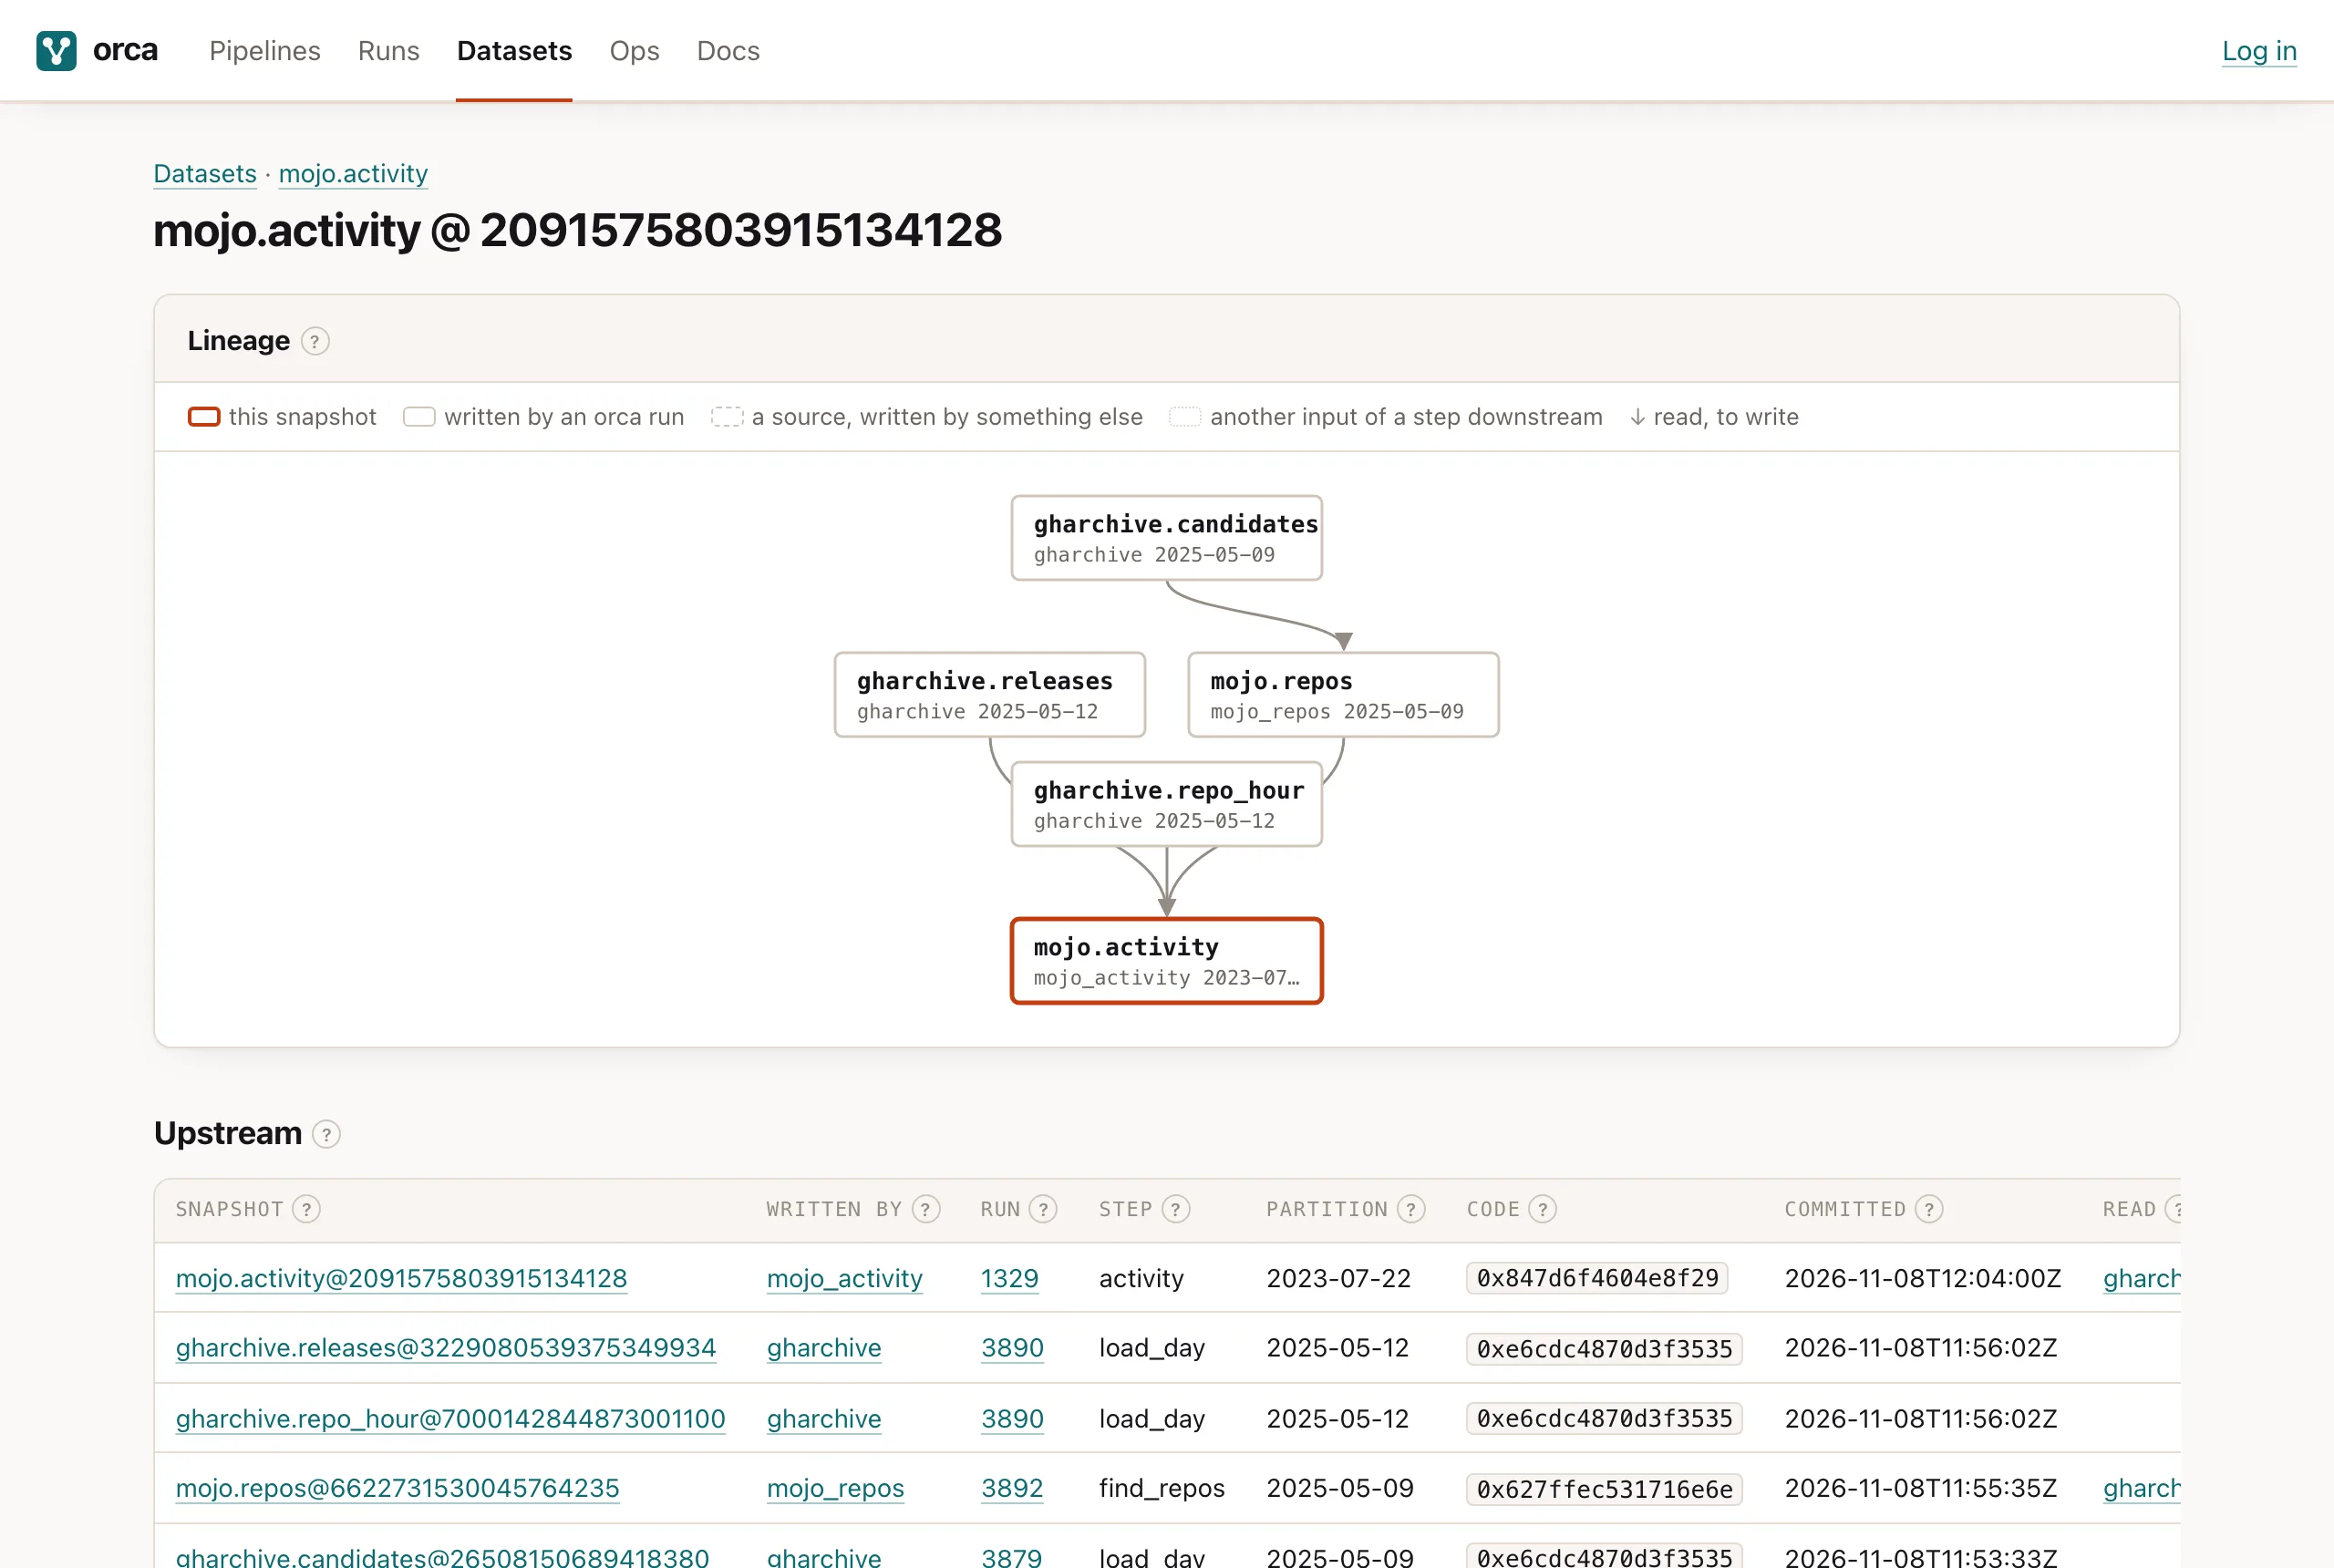
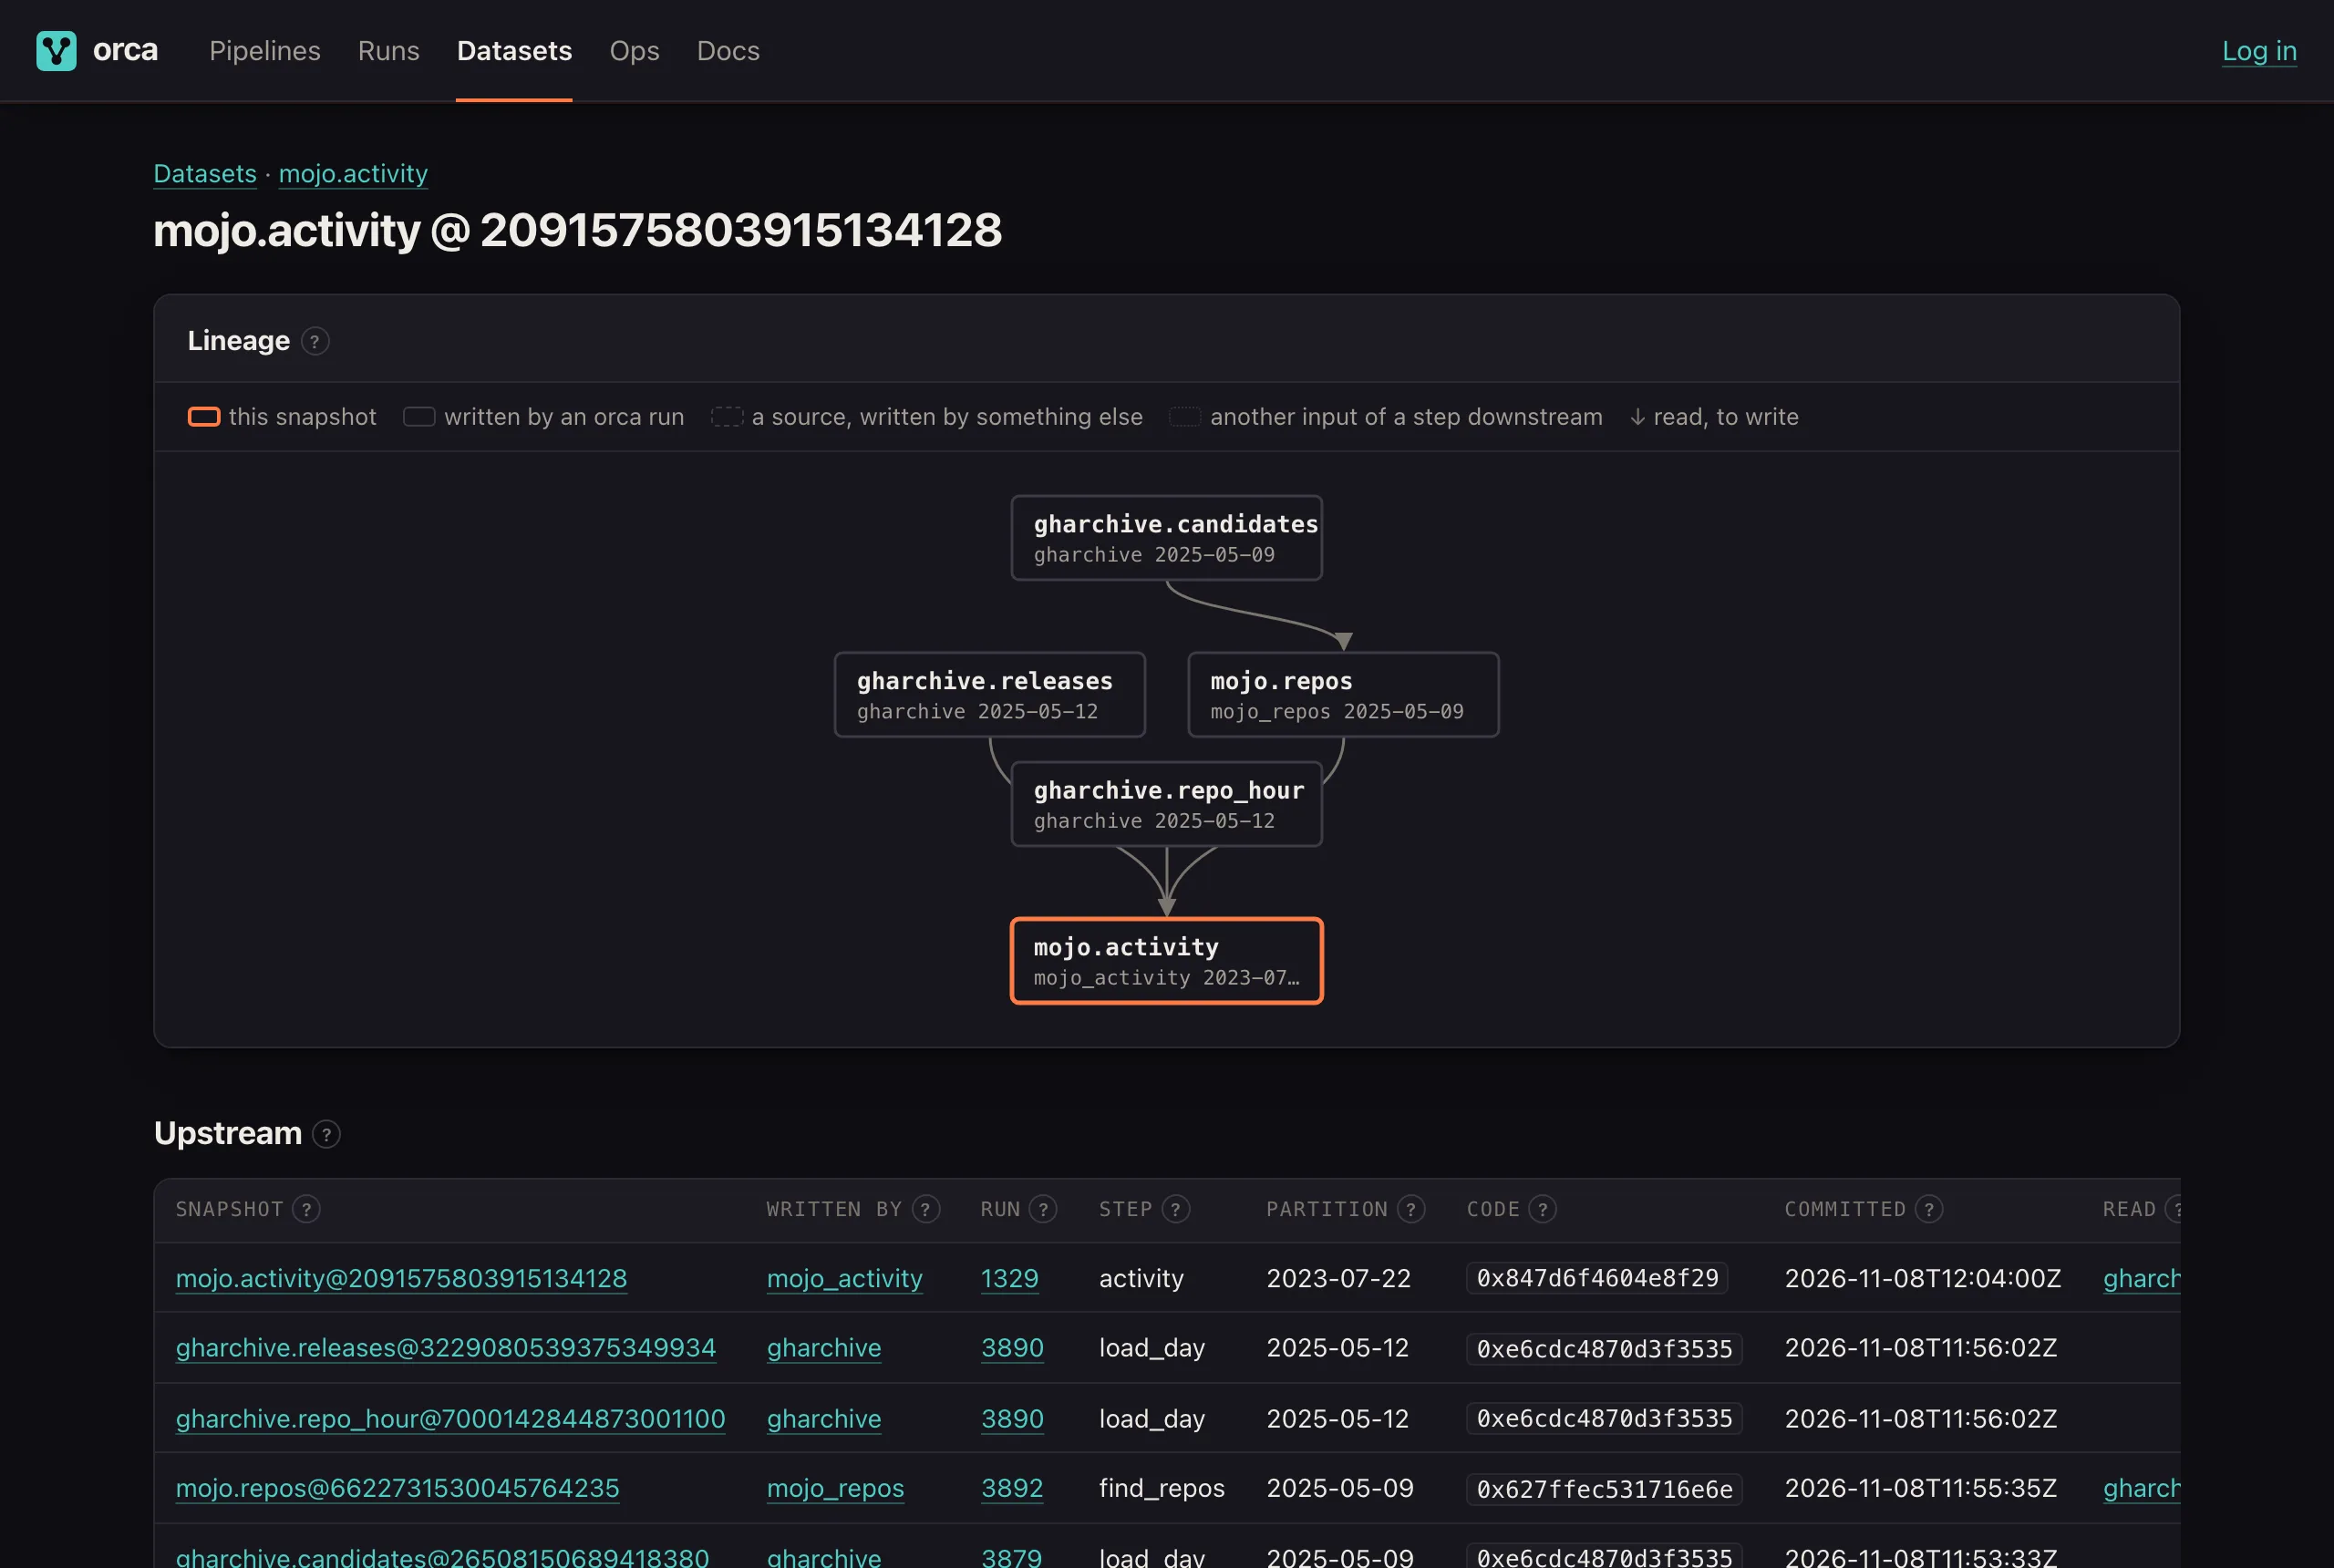
mojo.activity. The graph and the Upstream table show the exact snapshots it was built from, and the run, step, partition and code hash that wrote each.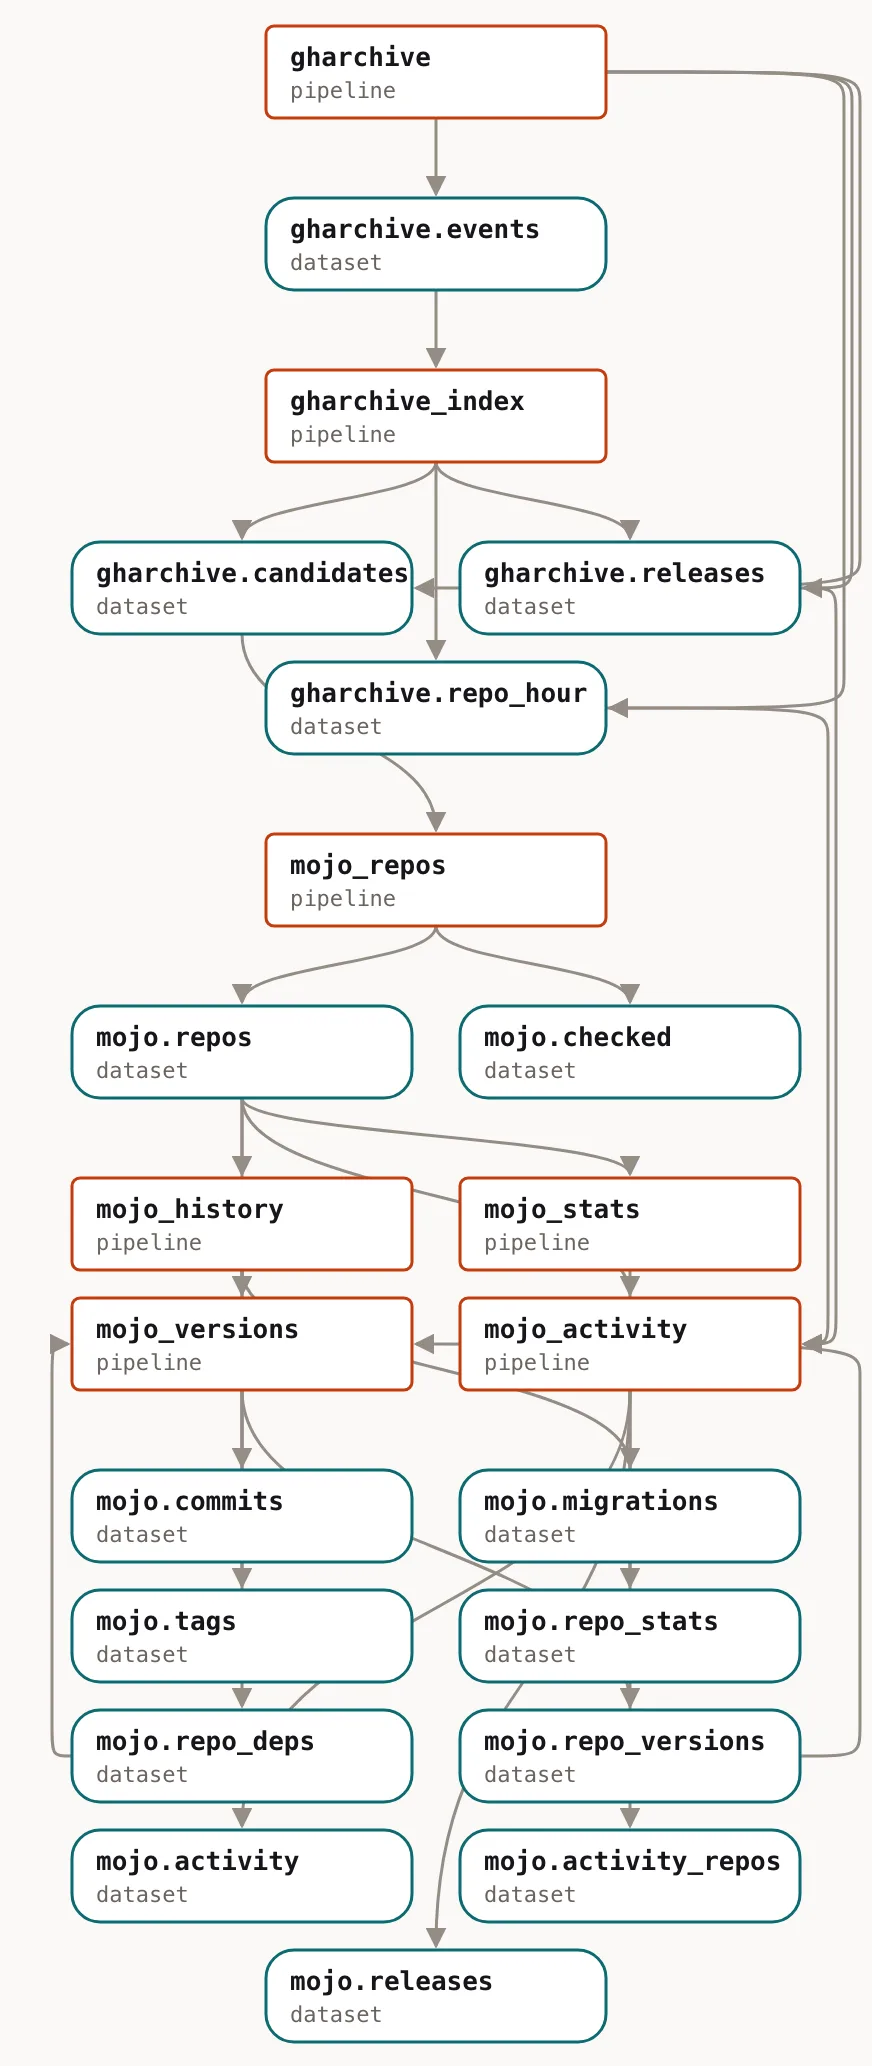
Tracking runs
morca’s state is in Postgres. A pipeline binary can also keep its runs in a
SQLite file when you run it by hand. A pipeline’s placement says which
machine starts its runs. The default is the scheduler’s runner, which is
local, ec2 or kubernetes. control runs small pipelines on the
scheduler’s own host, under a memory cap. worker:<pool> runs them on a
remote worker.
A remote worker connects to the cluster with one command:
ORCA_WORKER_TOKEN=orca_... orca worker --pool bgent --remote https://orca.example.comIt asks the API for the pool’s runs over HTTPS and runs them on its own machine. The run’s state calls go to the API, which writes them to Postgres, so the worker holds no database credentials and needs no inbound port. Its token is scoped to one pool and can be revoked. If a worker dies, its runs are requeued once their heartbeats stop. The workers page has the details.
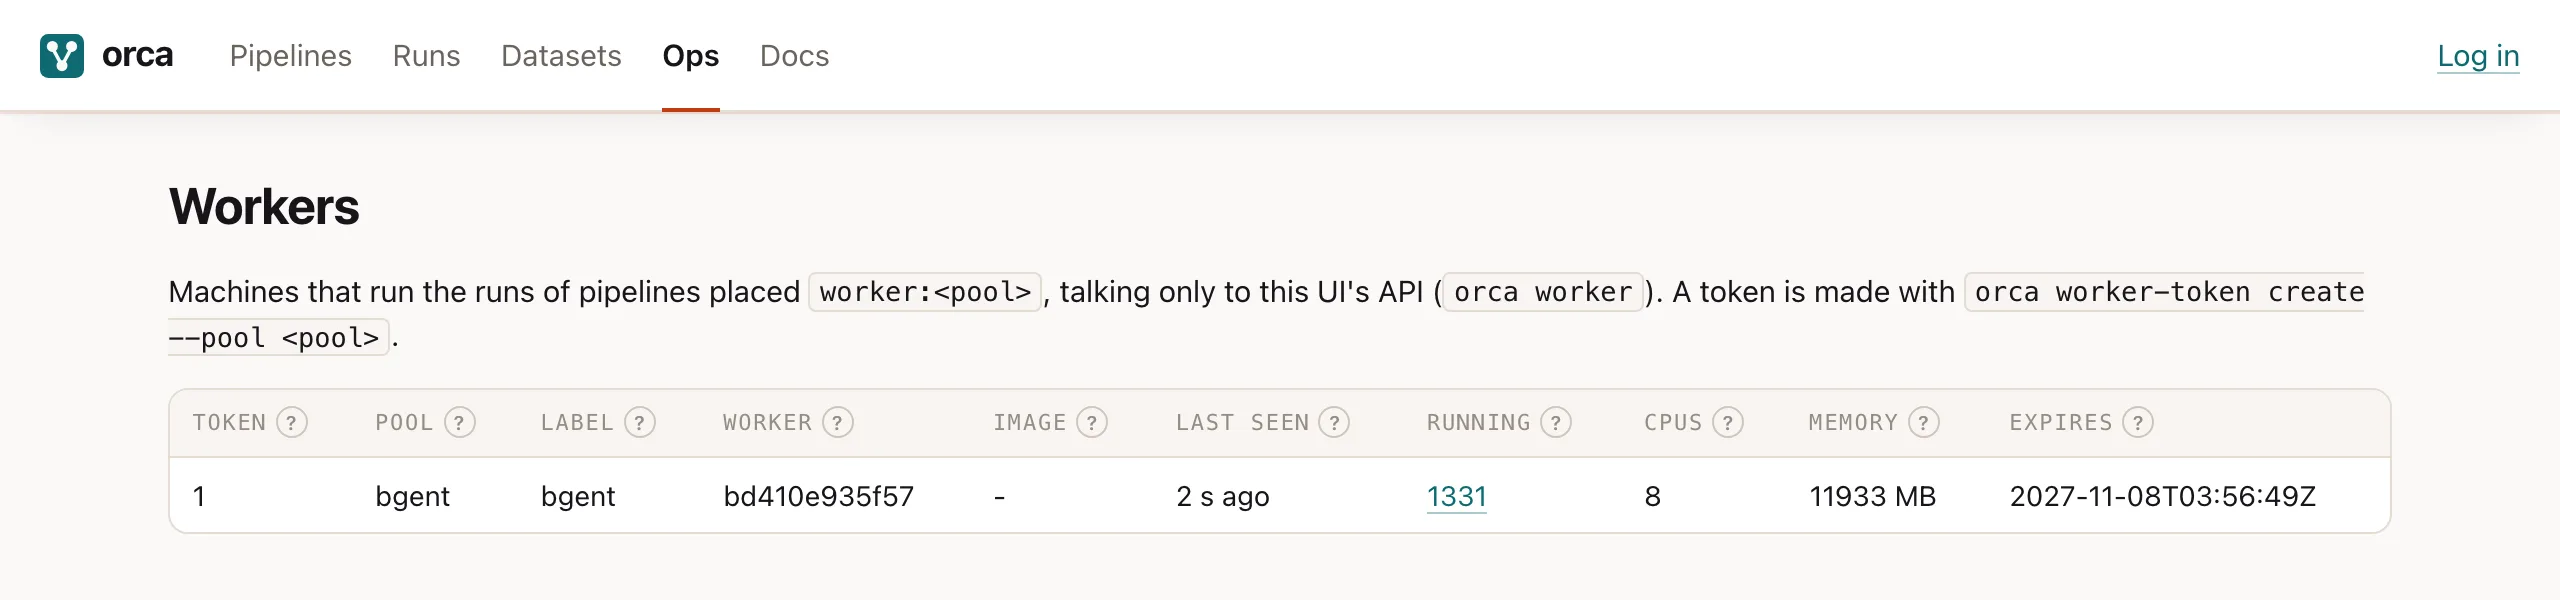
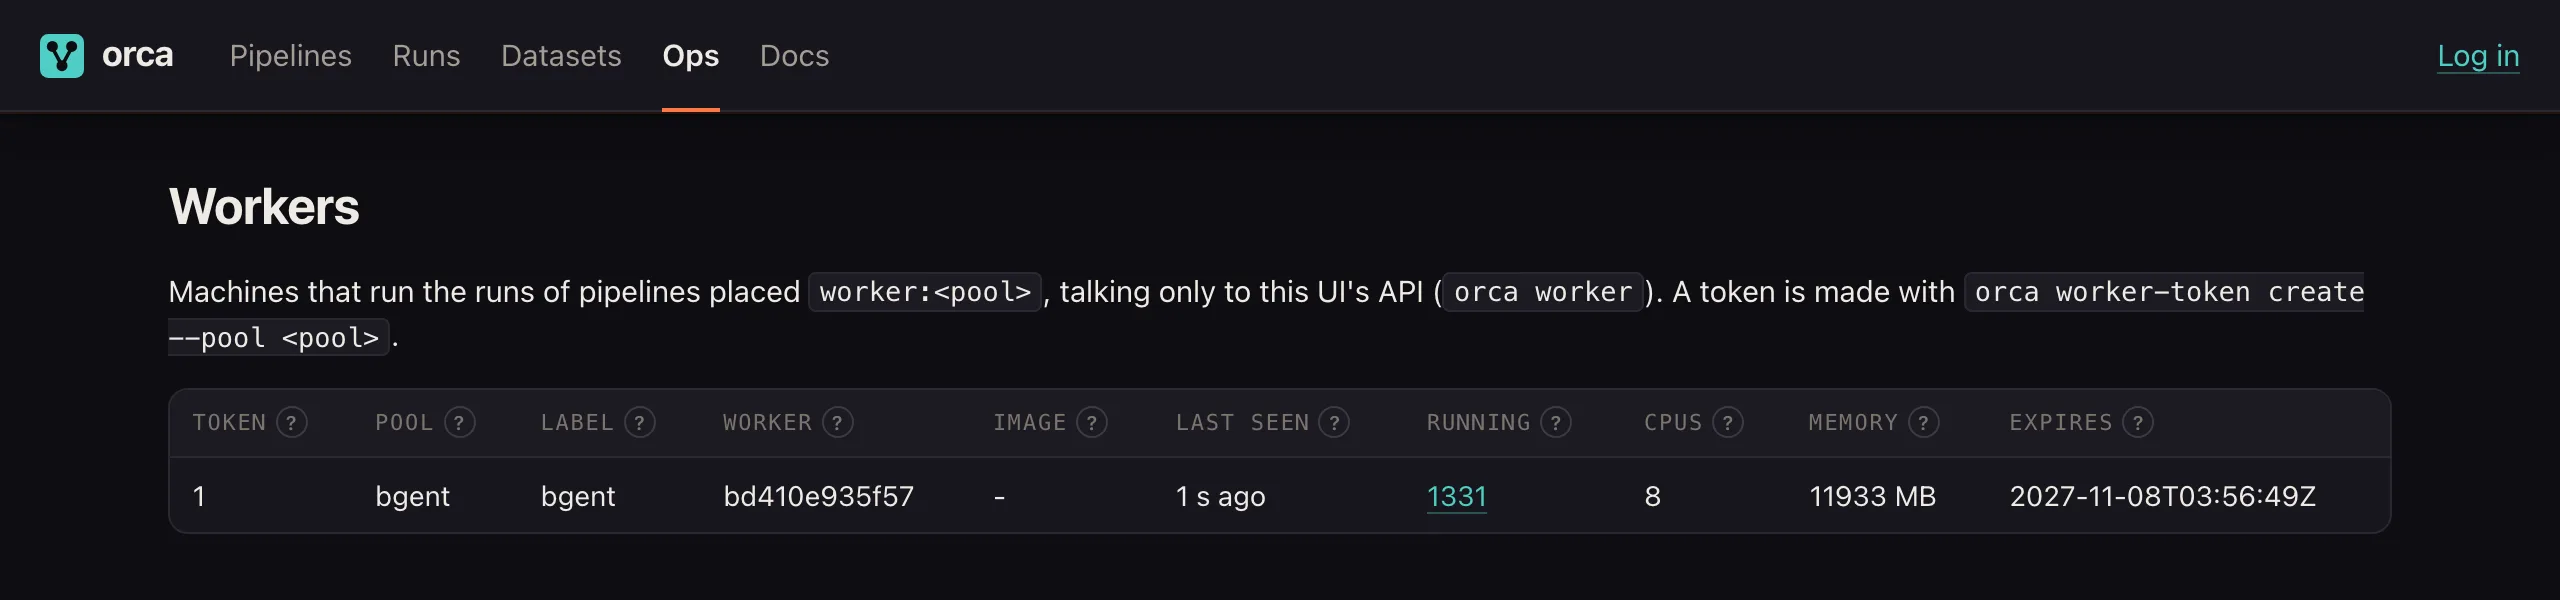
bgent, seen a second ago, in the middle of a run.orca.toml
A pipeline is defined in code, its execution parameters
in orca.toml, checked in next to the code:
[pipelines.mojo_history]
placement = "worker:bgent"
env = { DISTA_WORKER_SLOTS = "1" }
orca config show <pipeline> prints each setting with where it came from:
the code’s default, orca.toml, a flag, or the environment. orca config check checks a file before it is registered. The pipeline page shows
the same table, and each value links to its line in orca.toml at the
registered commit.
Resources for runs
Since 0.14.0 morca records each run’s peak memory and CPU
(#200) on the local
runner, on the control host and on workers. The pipeline’s Overview has a
Resources card with the p50 and max of its last 20 runs. For gharchive
today that is 731 MB p50 and 801 MB max, and about 3 cores.
A pipeline can also ask for a range of CPUs and memory
(#208). The scheduler
starts a run only if its minimum fits what the machine has left, and
otherwise holds it with a reason such as waiting: needs 2 GB, 1.3 GB free of grants. Since 0.15.0 a run can also get a cgroup of its own, with its
grant as the memory limit
(#201): a run that
goes over is killed alone and retried with 1.5 times the memory. And no
new run starts while the machine is already stalling on memory
(#202). Next is dista
sizing its in-flight work from the run’s grant
(dista #123). The
roadmap sets out the order and the papers each step
borrows from, from Borg and Autopilot to Dominant Resource Fairness and
morsel-driven parallelism.
Operations
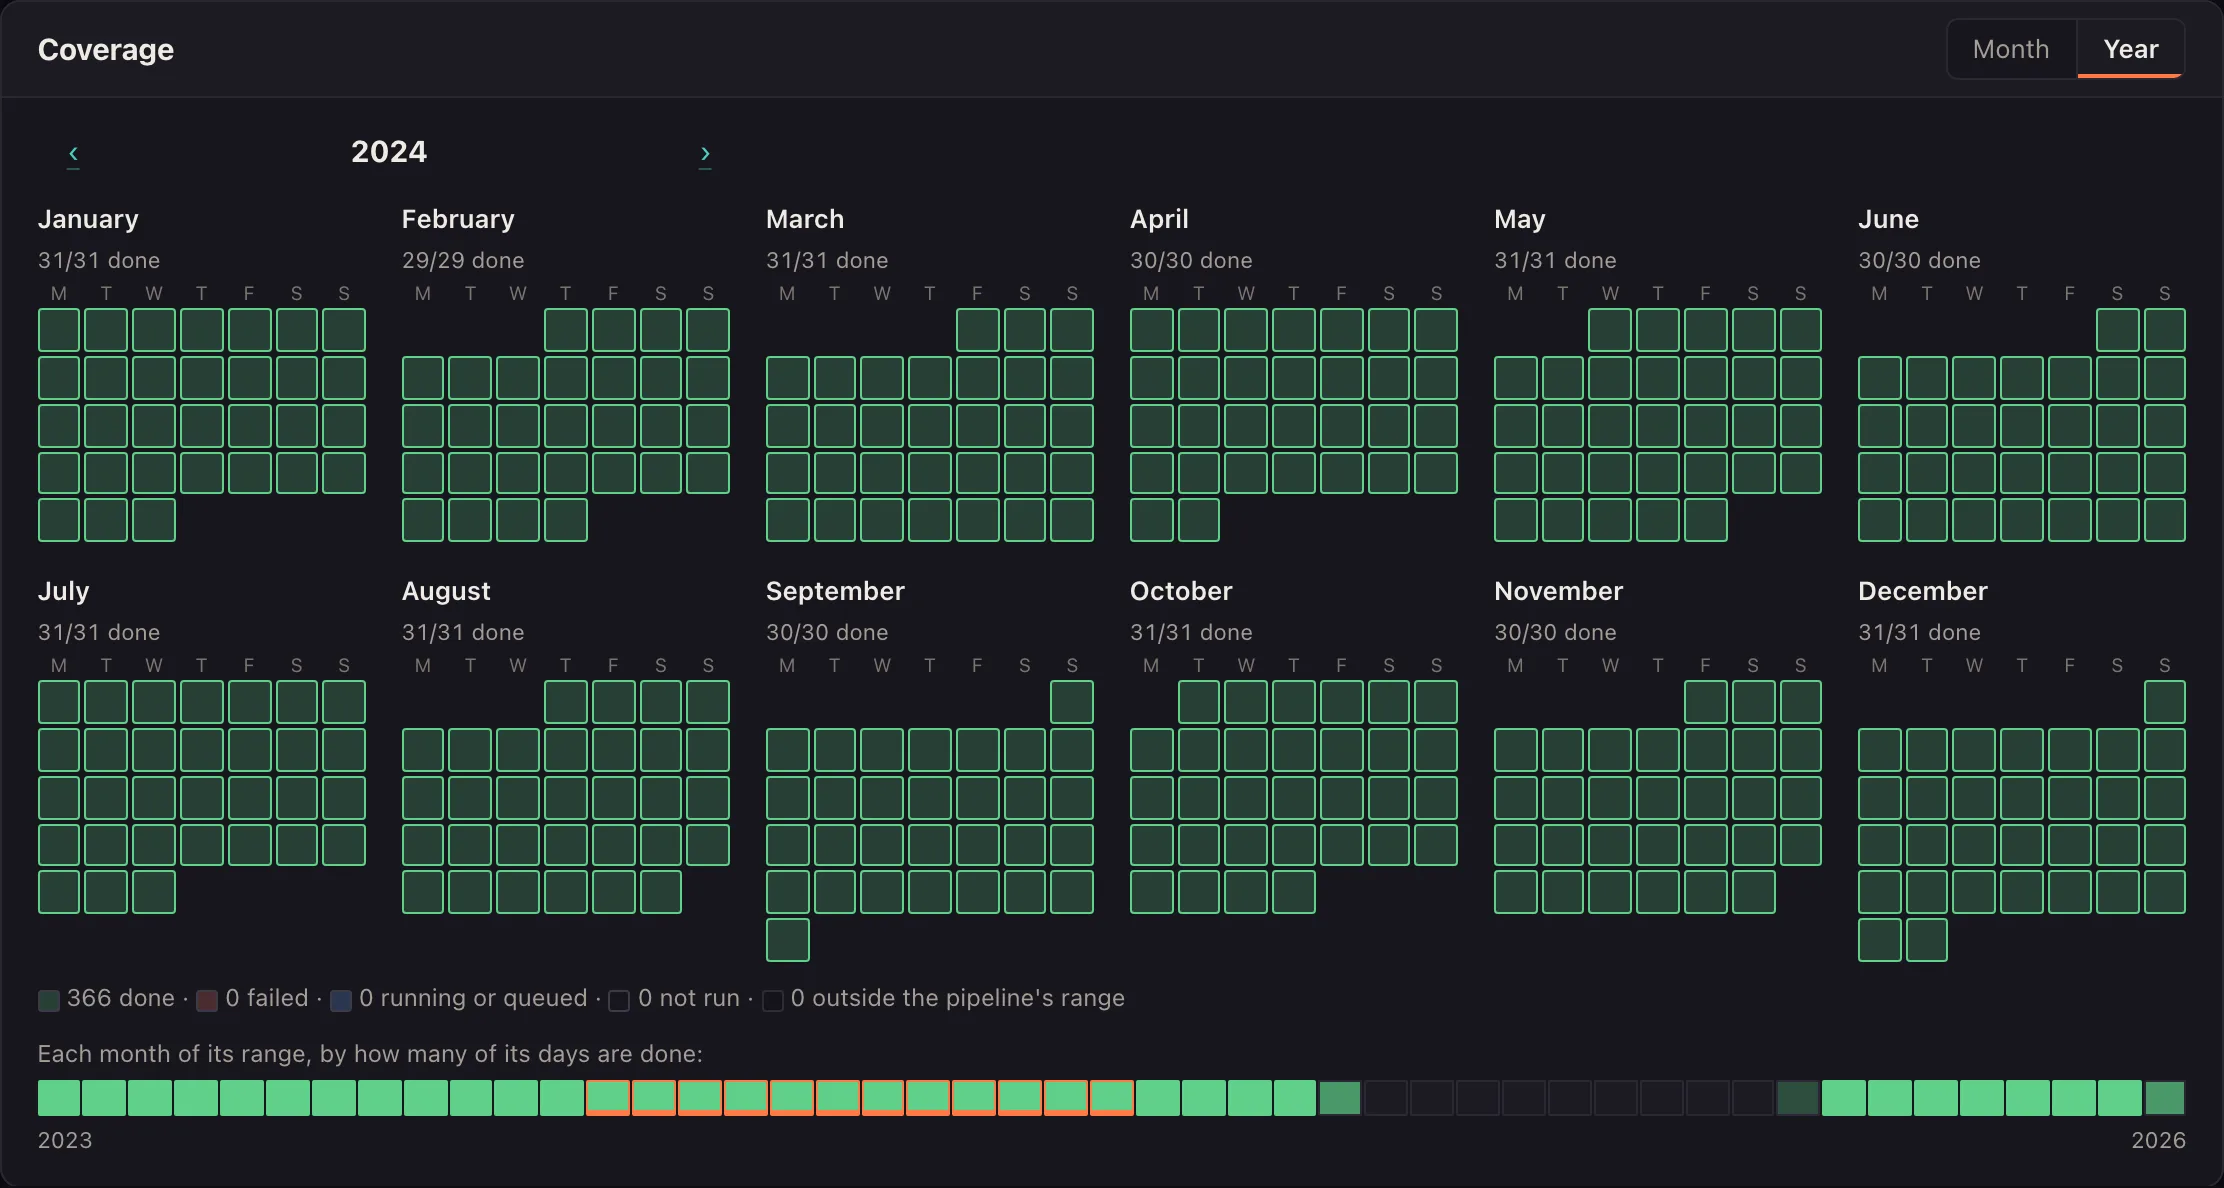
Each pipeline has a page with Overview, Runs and Operate tabs. Operate has a coverage calendar with a year view: twelve small months of days, coloured by done, failed and open. For a sensor pipeline it also marks the days it is behind on what it follows. A run’s page is a set of cards, with its steps as a table, a timeline or a graph. Hovering a step shows a card with its function’s signature and docstring from the code at that commit, what it reads and writes, and how long its attempts took. Run lists and run pages refresh by themselves while something is going.
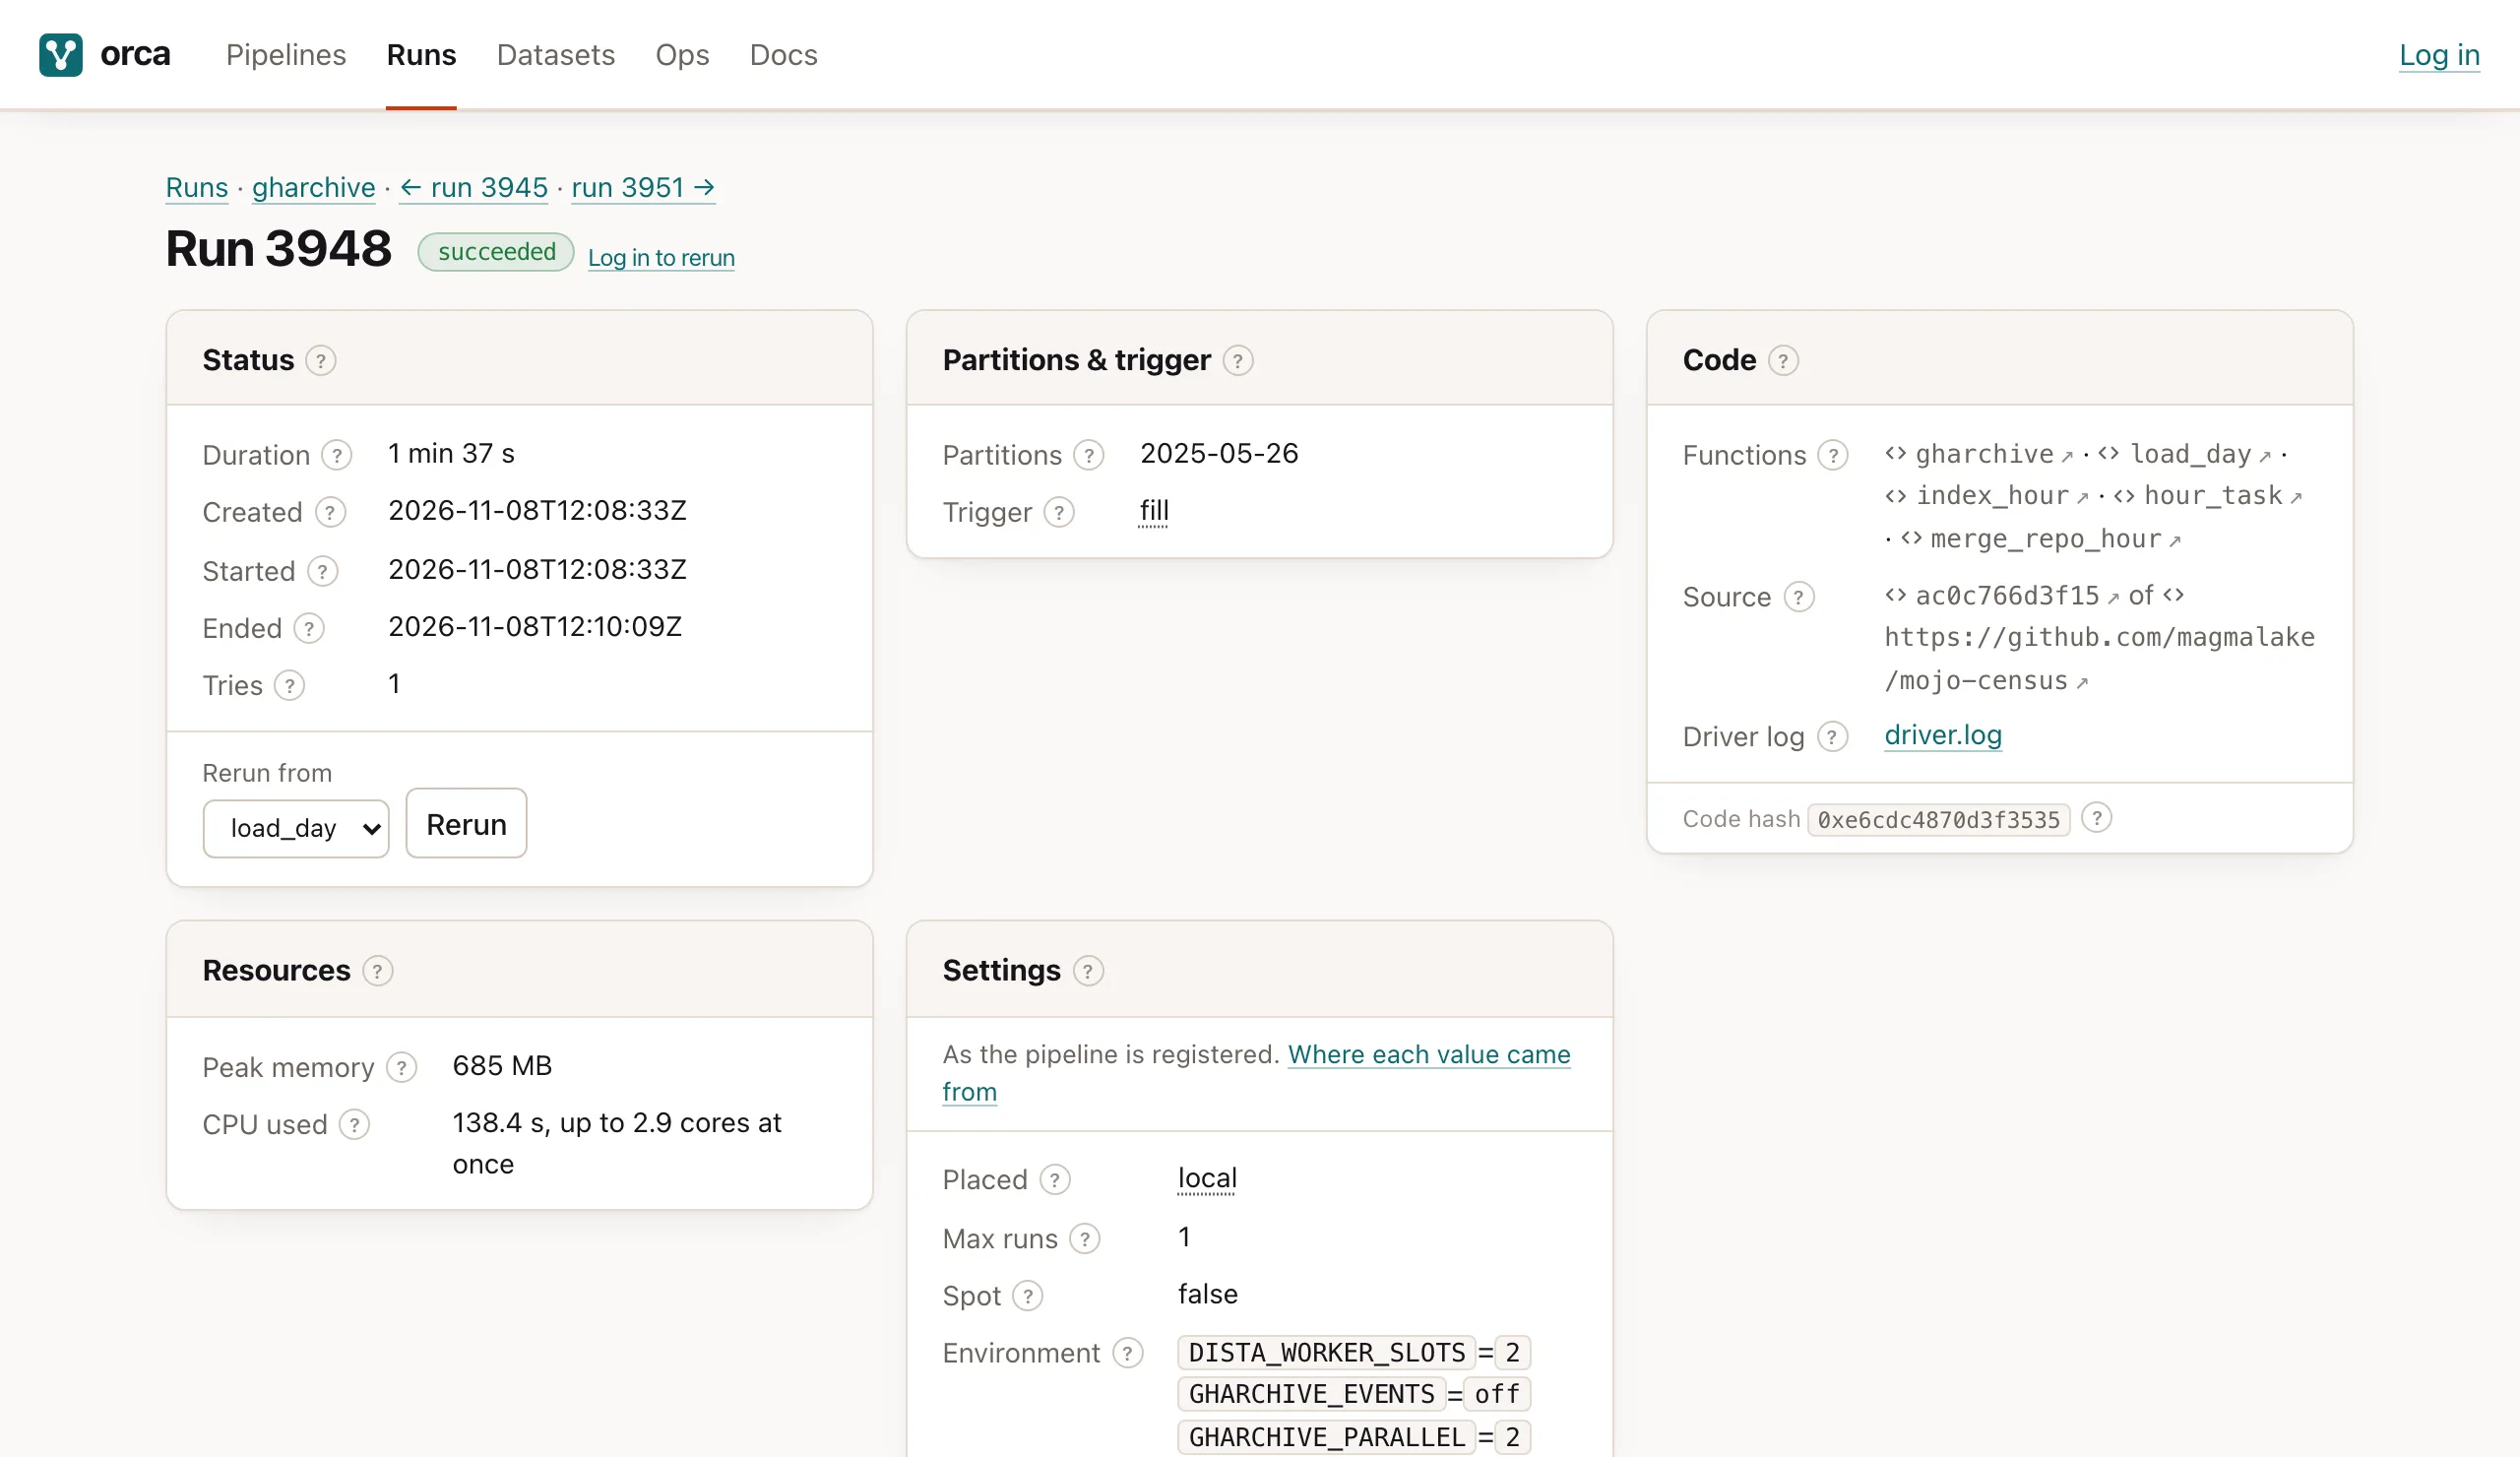
gharchive fill run: one day, 1 min 37 s, 685 MB at its peak. The Code card links each function at the commit that ran, and Settings shows the environment it ran with.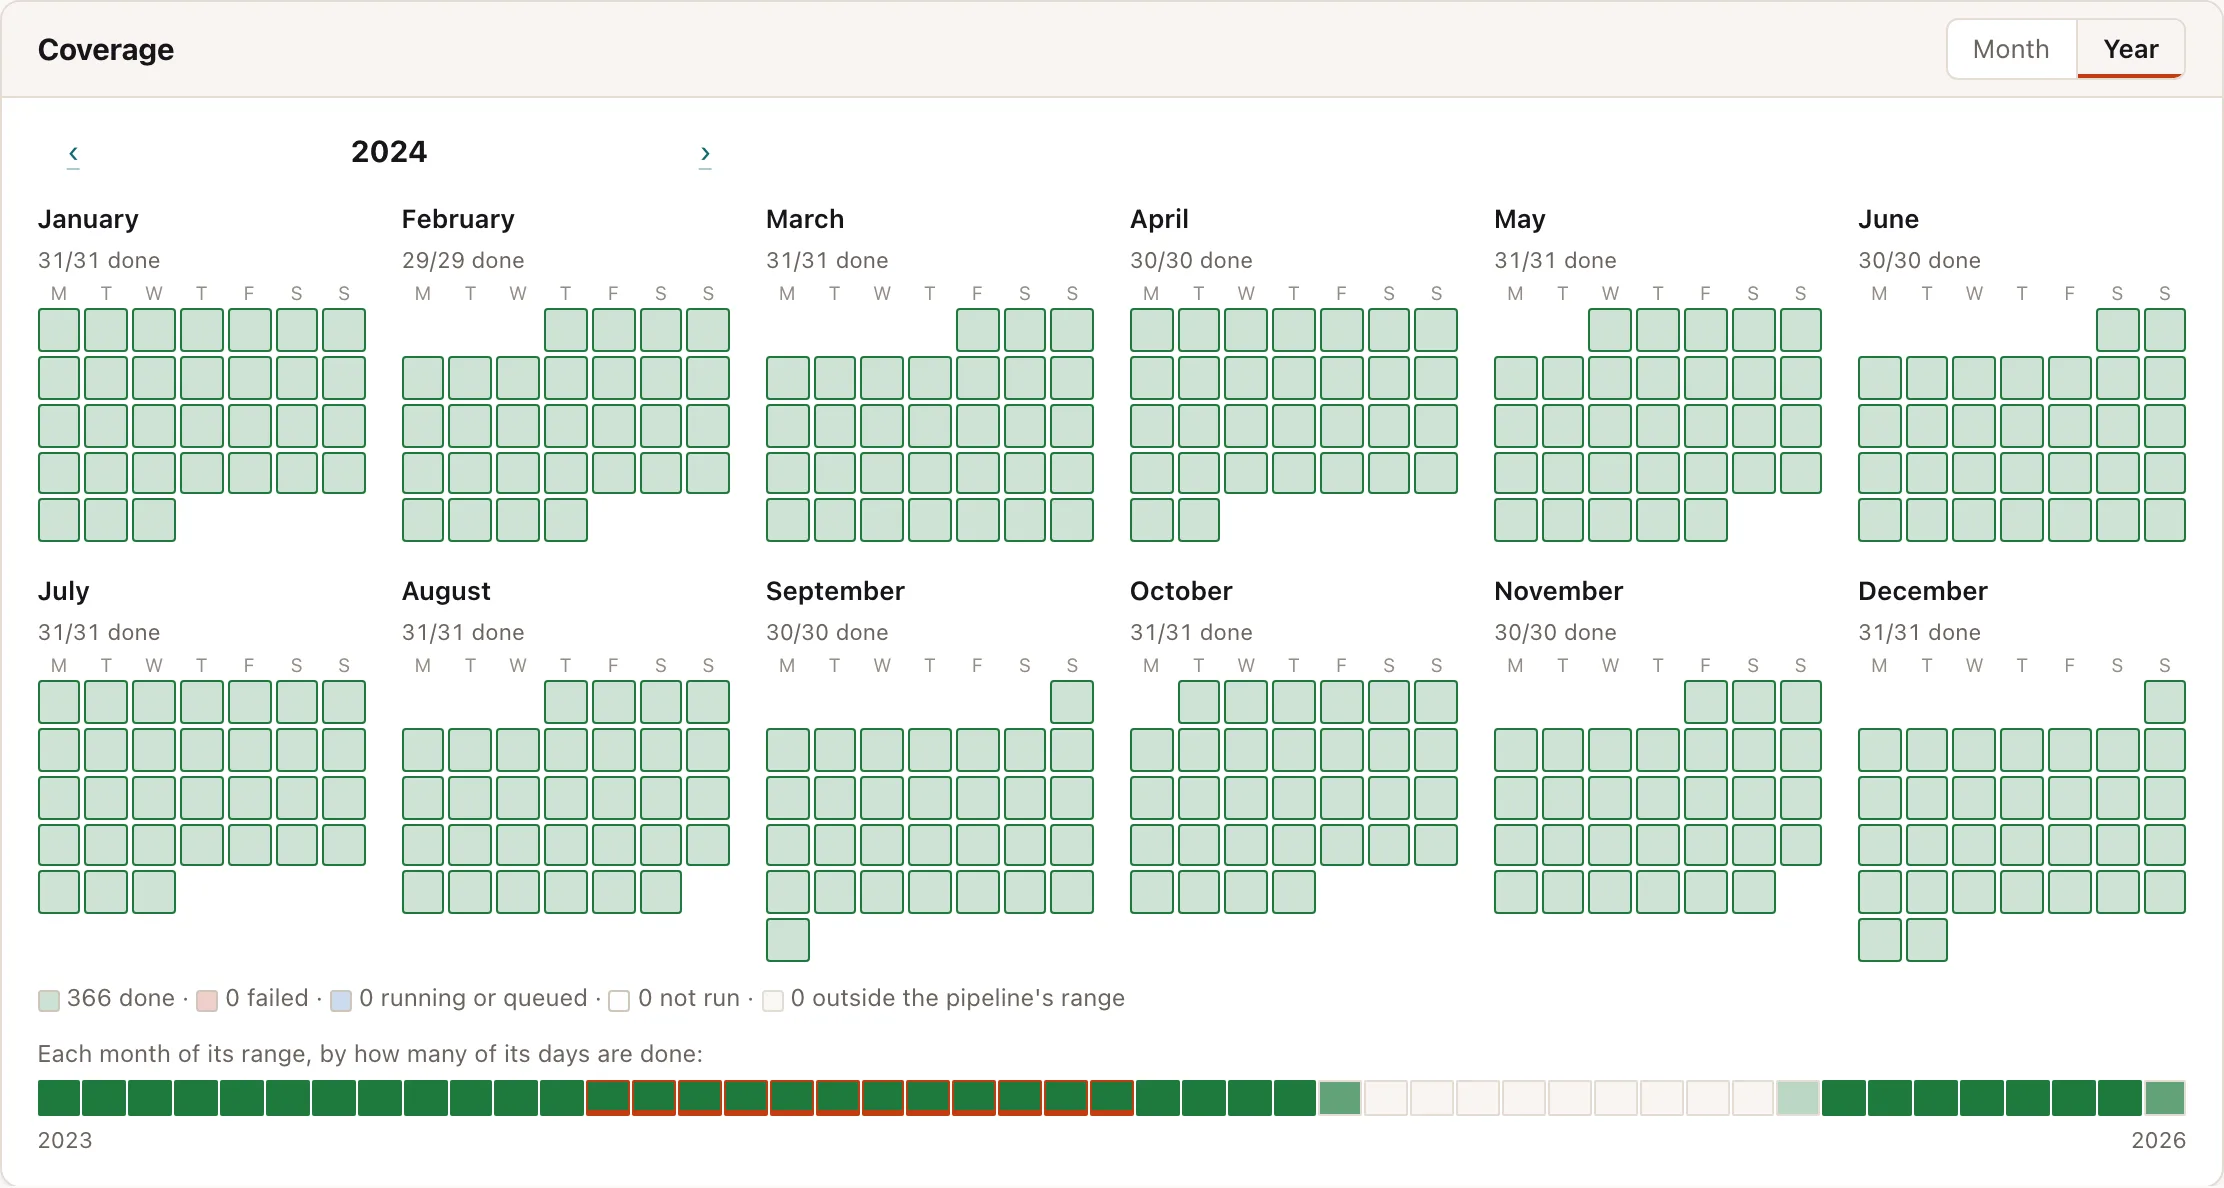
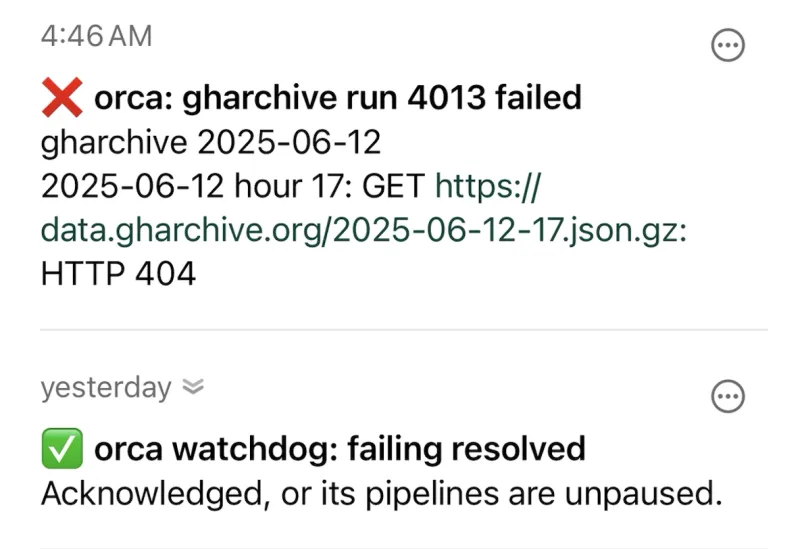
Every minute a watchdog checks launches, cost, idle workers, failing attempts, stuck runs and the control host’s memory and disk. A rule past its threshold pauses the pipelines involved. It never resumes anything. Alerts go to your phone through ntfy.
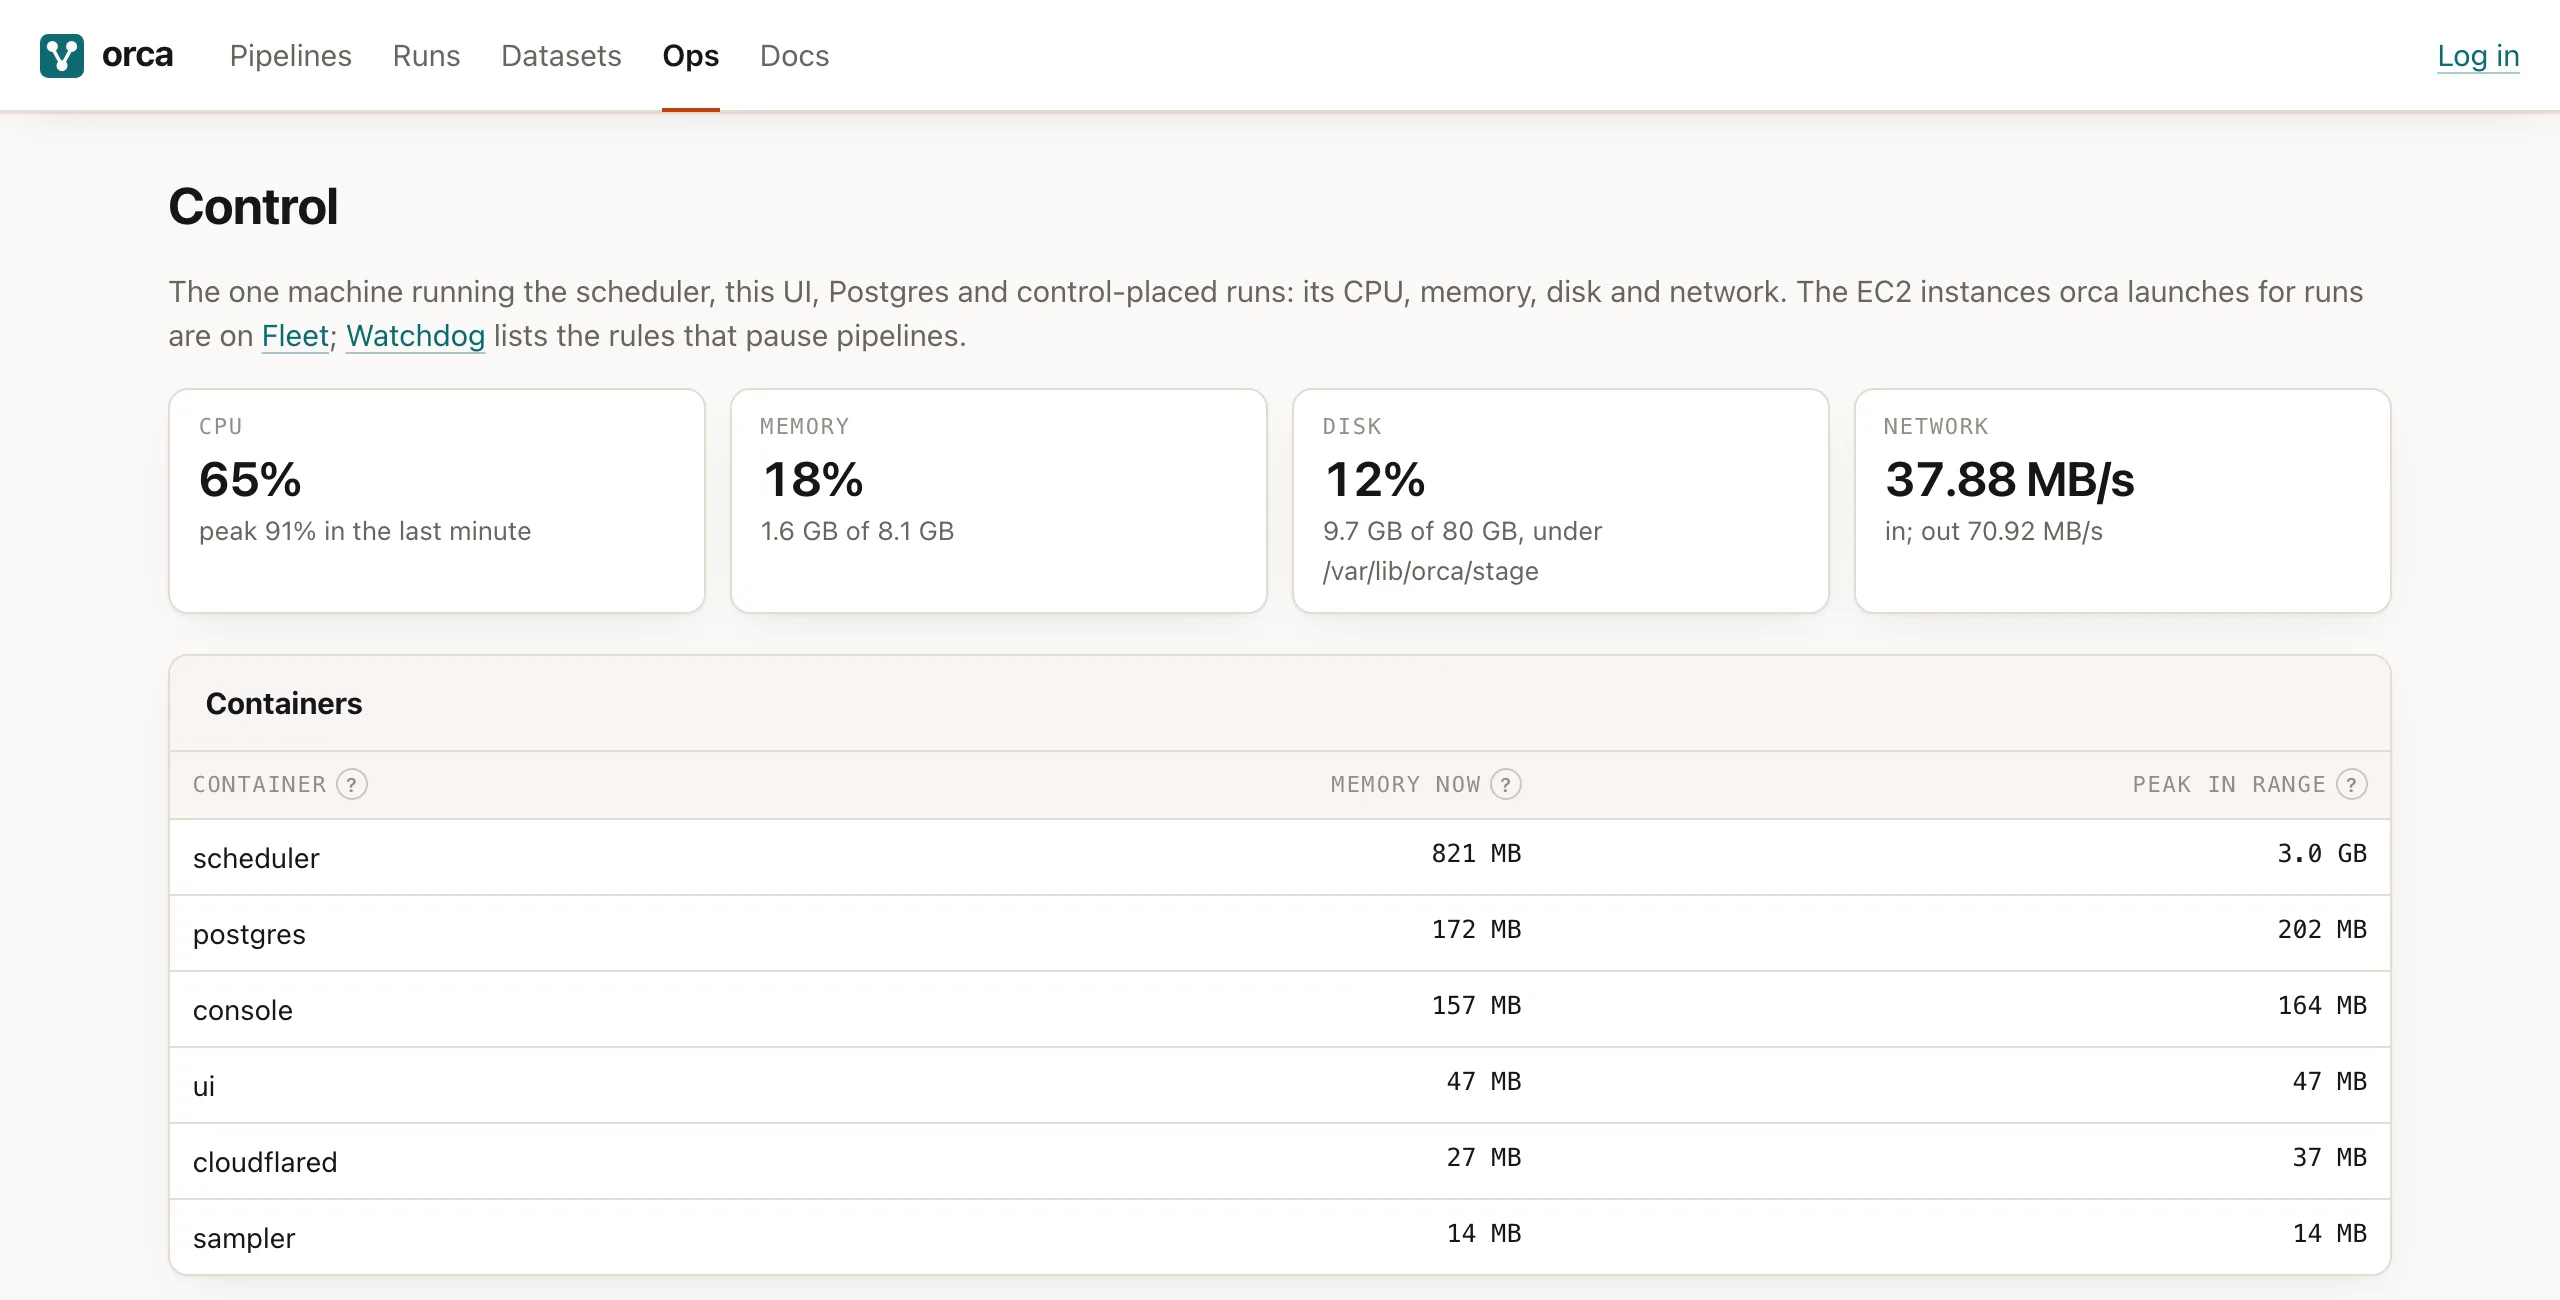
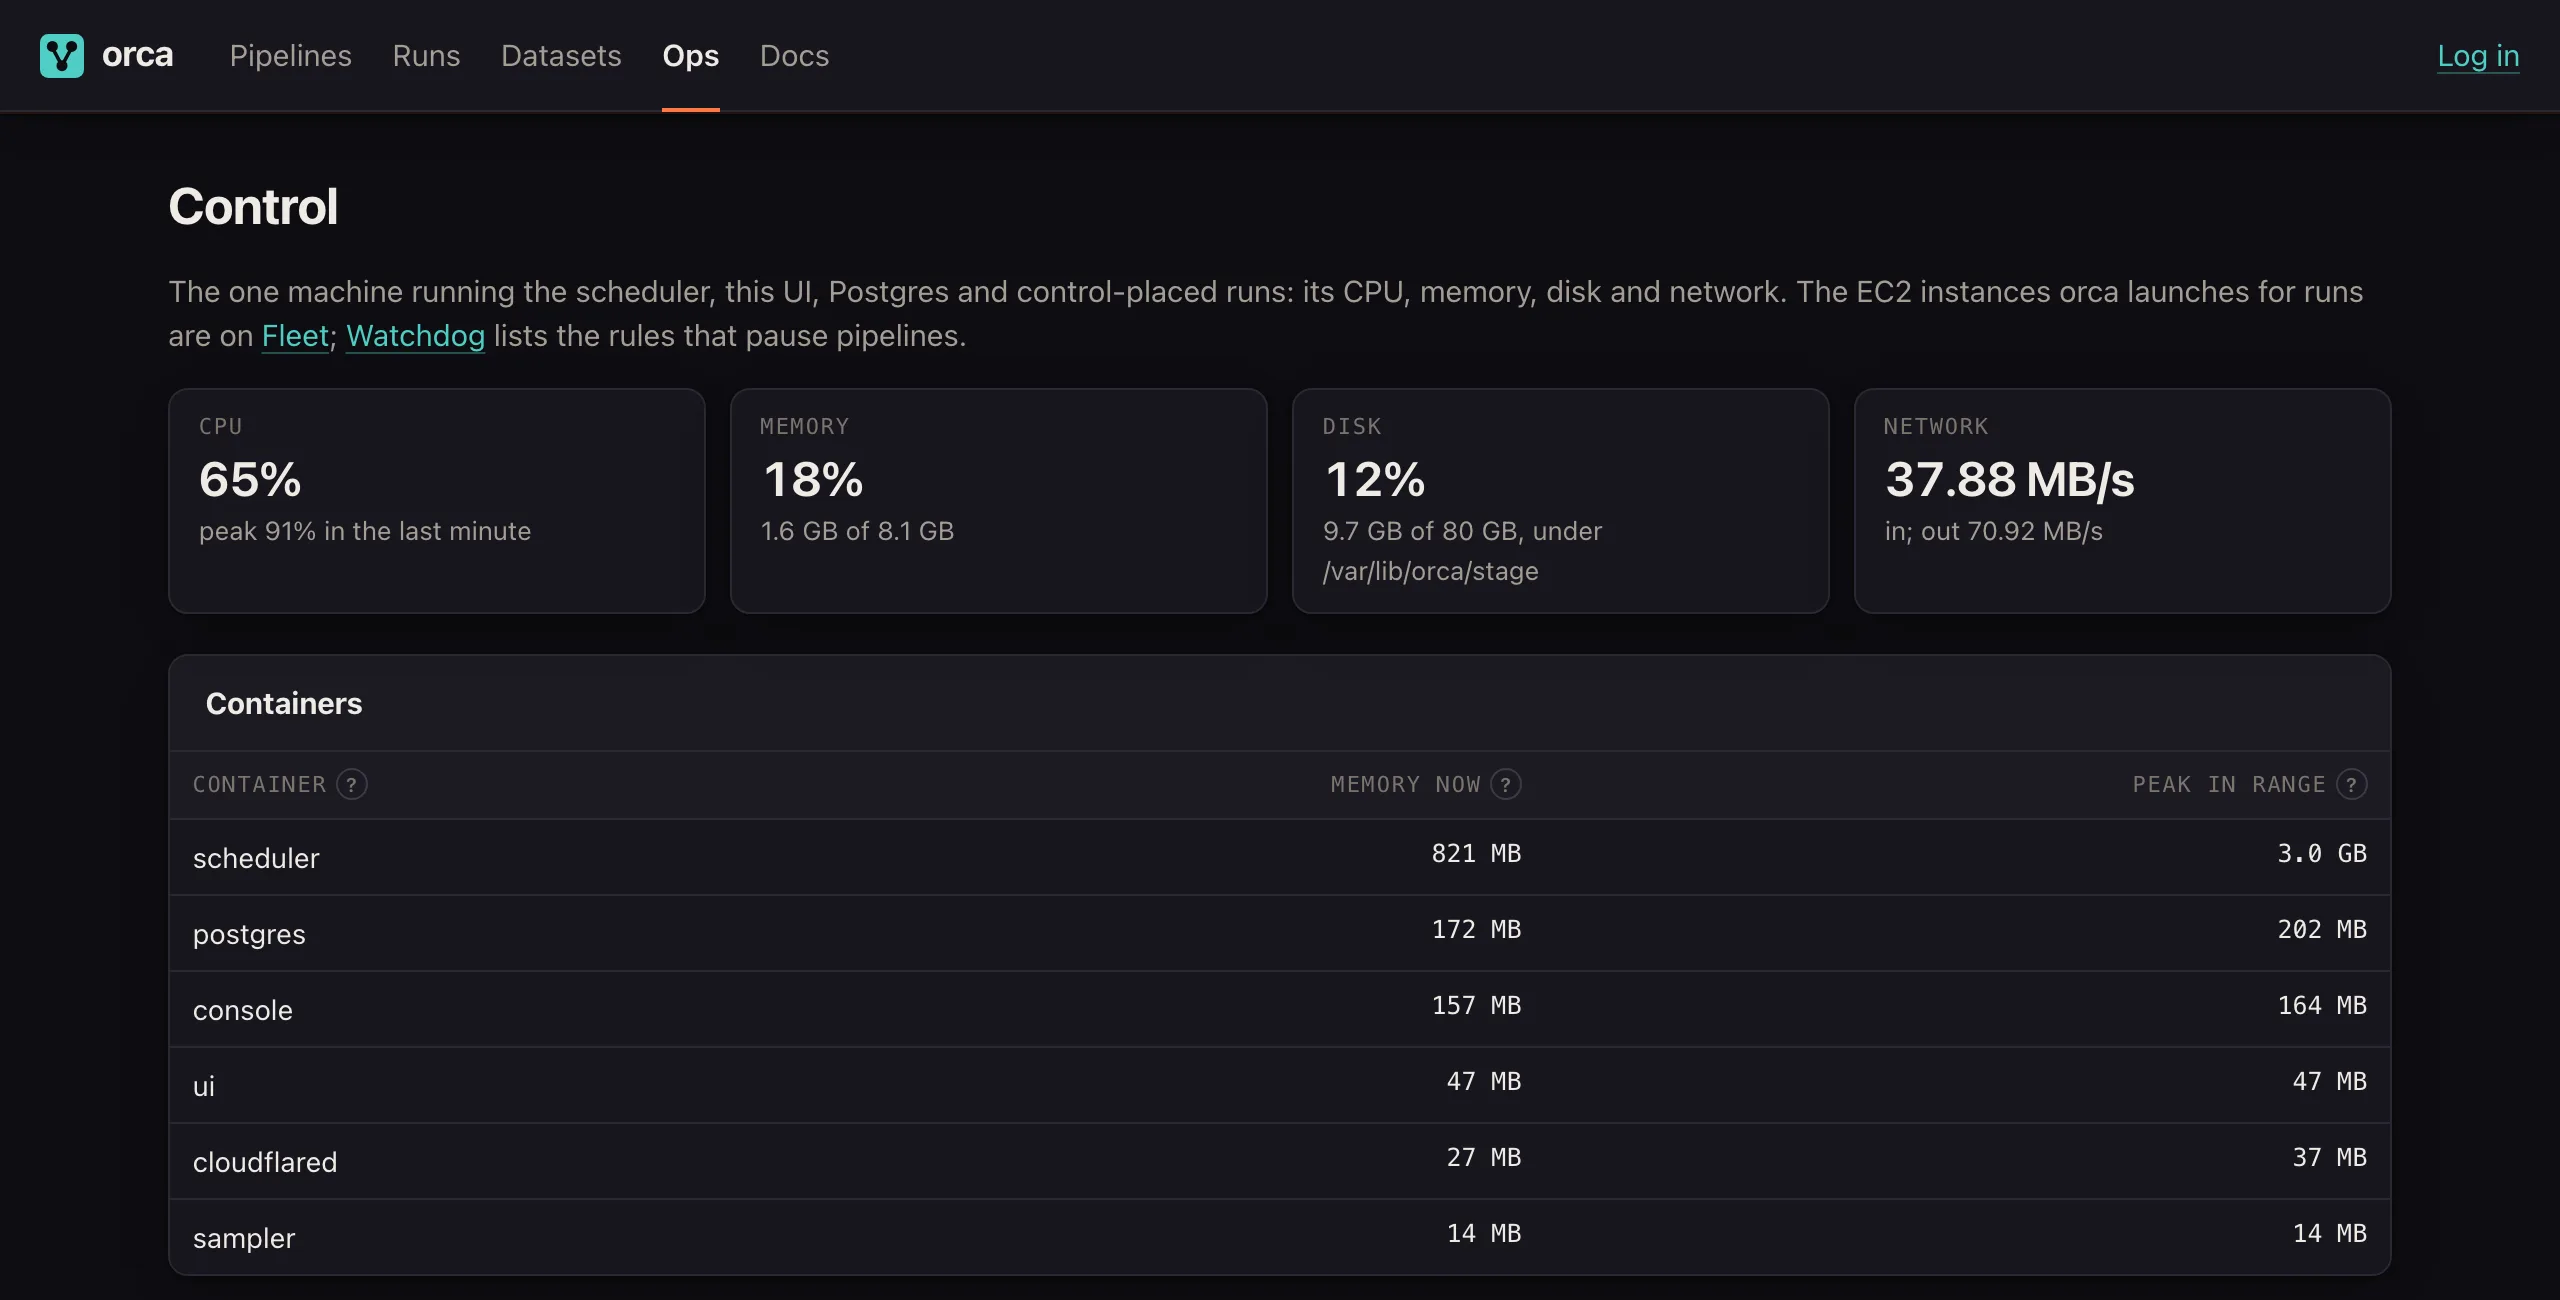
This week showed how that works. A typo in the server’s orca.toml placed
two of the census pipelines on the control host, under its 1 GB cap. Every
attempt of mojo_activity was killed just over that. Within the hour the
watchdog paused it, and a high-priority push arrived on the phone: “Watchdog
paused pipelines: failing mojo_activity: 10 of 10 attempts failed in the last
hour”, with a link. The run’s page said exactly why:
killed: its processes held 1028 MB, over the control instance’s cap of 1024 MB a run (ORCA_CONTROL_MEMORY_MB)
The fix was one line per pipeline, placing them on the worker pool. Once
mojo_activity was unpaused the trip cleared, and a low-priority “resolved”
push followed.
Mojourney on morca
Mojourney runs on one Hetzner CAX21, a 4-vCPU ARM server with 8 GB of RAM
for a fixed €12.49 a month. It runs the scheduler, the UI, Postgres, the
Mojourney site and the GH Archive backfill. An Apple-silicon Mac is a remote
worker of pool bgent. It runs mojo_history and mojo_versions, which
clone every repository, and since this week mojo_activity.
The backfill is gharchive with fills = "all". Its Progress card says all
1,407 days are done, from 2023-01-01 to yesterday. One, 2025-06-12, is short
the 17:00 hour, which GH Archive never published. A day’s raw events were 1.1 GB, 97% of the bucket,
and the census only needs the index built from them. After it stopped writing
them, an hour of GH Archive in flight took about 200 MB instead of 450 MB.
With two fill runs at a time, the backfill went from about 22 days an hour
to 63 an hour, and it finished on 2026-11-08. While it ran, the card showed
the current rate and an ETA.
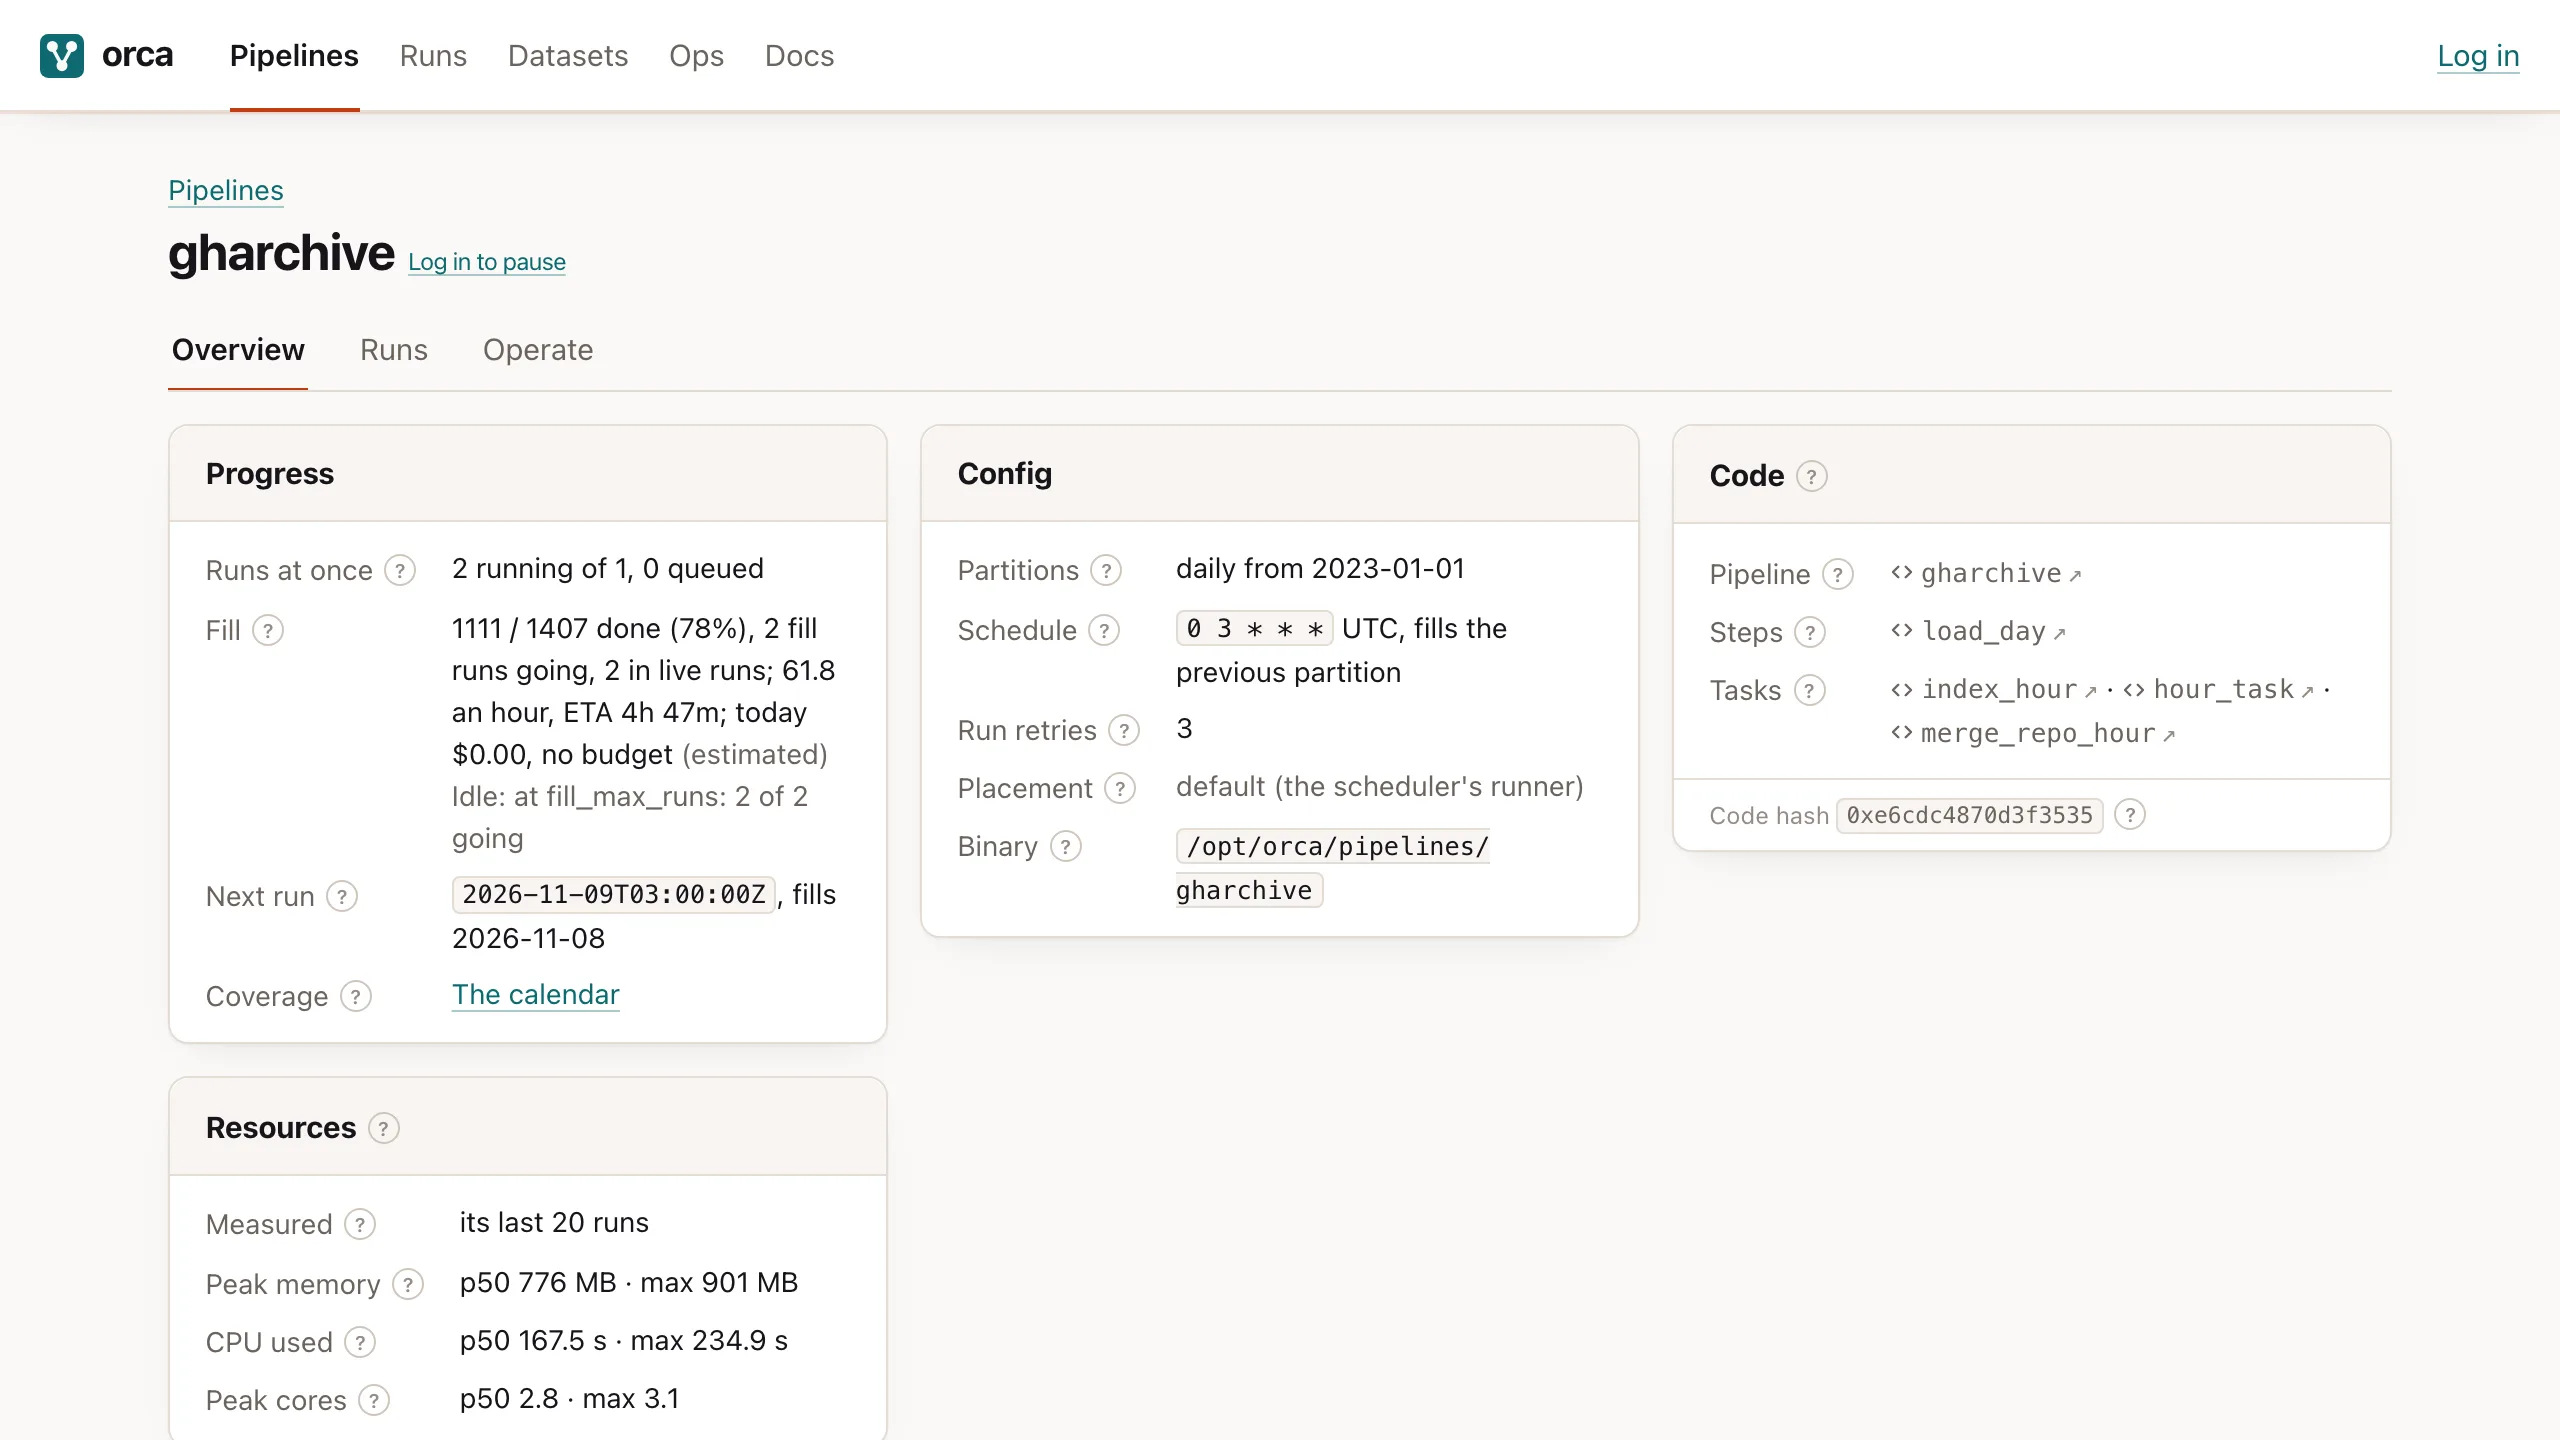
gharchive pipeline page while the backfill ran. Progress has the fill, its rate and ETA; Resources has what its last 20 runs used, measured.The UI and the census site are both Mojo HTTP servers built on flare, by Ehsan M. Kermani. The site runs its own data checks before a new build goes live, and shows them at mojourney.dev/checks.
Still ahead
- Deploys that interrupt nothing. Today a deploy pauses the pipelines, waits for the running runs and restarts everything. Next, it restarts only what changed (#230), starts the new UI before stopping the old one (#231), and runs survive a scheduler restart (#232).
- CPU for the control plane. Runs should yield the CPU to the scheduler, the UI and Postgres (#229), and the per-run cgroups should be on by default (#239).
- Self-hosted pools. Declaring pools in
orca.tomland joining a machine withorca host join(#220). - Resources on EC2 and Kubernetes. Peak memory and CPU are not measured there yet, and the Kubernetes runner does not pass secrets to its pods.
Where to go next
To build a pipeline of your own, Getting started sets up a project from scratch and builds the census with it. To see where morca is headed, and the papers each step borrows from, the roadmap has the plan.